Tag Archives: economy

How to Spend More on Education and Transportation Without Raising Taxes

By Adam Pagnucco.  

It’s election season and that means it’s time for lots of promises from politicians.  And boy are they promising a lot, especially on the county’s two big issues of education and transportation.  The mailbox’s “progressive leaders” have “plans” to guarantee every child a great school, invest in transportation – especially transit – and to do all of the above without raising taxes.  Sounds great, yeah?

Time to get real, folks!

Education and transportation each have two virtues.  First, each of them generates direct economic returns.  Education spending yields a return on human capital while transportation spending yields a return on physical infrastructure.  Both are important for attracting and retaining residents and jobs.  Second, each of them is popular with voters.  For as long as anyone can remember, education and transportation have been two of the top issues in our elections – and they might possibly be THE top two.  Happily, on these two issues, good policy and good politics come together!

Paying for them is another matter.  MCPS accounts for a greater percentage of the budget than any other agency with a $2.5 billion budget in FY18.  Montgomery College received more than $300 million.  The Department of Transportation’s operating budget was $56 million.  Funding increases with meaningful impacts on these agencies need to be in the tens of millions of dollars – at least.  That kind of money far exceeds a spreadsheet rounding error.

And yet, there is a way to increase spending on MCPS, the college and transportation without massive tax hikes.  The catch is that it’s not quick or easy.

Let’s do a simple (and yes, admittedly simplistic!) exercise with the operating budget.  First, let’s identify the combined local dollar spending on MCPS, the college and the Department of Transportation (DOT).  Next, let’s segregate out intergovernmental aid, which plays an important role in the budget but is not controlled by the county government.  Then let’s segregate debt service.  Yes, over long periods of time, the county can adjust debt service.  But much of the debt service is being paid on capital projects already completed, and furthermore, a huge chunk of it goes to school construction and transportation projects.  Boosting education and transportation operating budgets by cutting their capital budgets is not the best idea in the world!  Finally, let’s subtract out local dollar education and transportation spending, intergovernmental aid and debt service from total spending and what we get is a great big category that we shall creatively name “Everything Else.”

Here’s what happens when we do that for FY11, the trough budget year of the Great Recession, and FY18, the budget that ends on June 30 of this year.

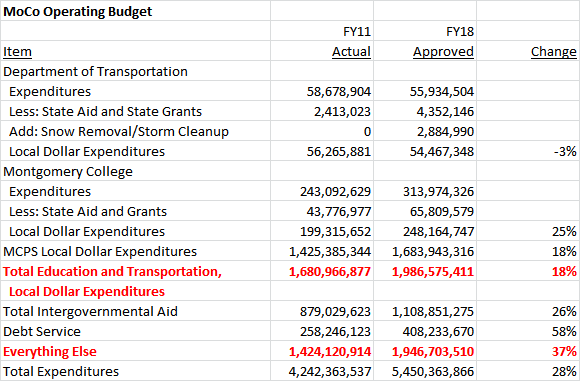
What the above data shows is that the total county budget grew by 28% over this period.  Intergovernmental aid grew by 26% and debt service rose by a whopping 58%.  (We have previously written about the county’s rapidly growing debt.)  Now let’s contrast the two remaining broad categories: the local dollars spent on MCPS, the college and DOT and everything else.  The education and transportation budgets grew by a combined 18%.  Everything else grew by 37%.

That’s right folks – spending on everything else has been growing twice as fast as local dollar spending on education and transportation operating budgets.  That’s a strange fact in a county in which education and transportation are arguably the top two political issues.

Now what would have happened if the everything else side of the budget was restrained to grow at the same rate as inflation?  The average annual growth rate of the Washington-Baltimore CPI-U since 2011 has been 1.3%, meaning that prices have grown by 9.8% over that period.  When we hold the total budget, intergovernmental aid and debt service constant and assign a growth rate of 9.8% to the everything else category, here’s what happens to local dollars available for education and transportation.  For the purposes of discussion, let’s call this Scenario 1.

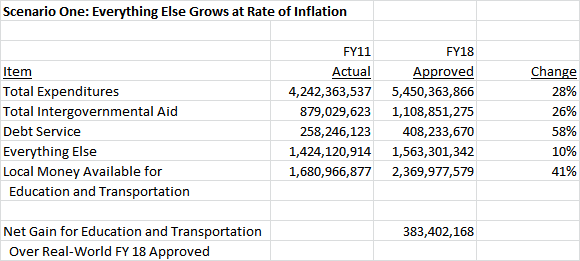
In Scenario 1, $2.4 billion is available for education and transportation because of spending restraint on everything else.  That’s $383 million more than the $2 billion that was actually available in the real world FY18 budget.

Holding a big chunk of county government to the rate of inflation for seven straight years is tough medicine and very unlikely.  So let’s create a Scenario 2 in which the everything else category is restrained to twice the rate of inflation, or 19.5% growth since FY11.

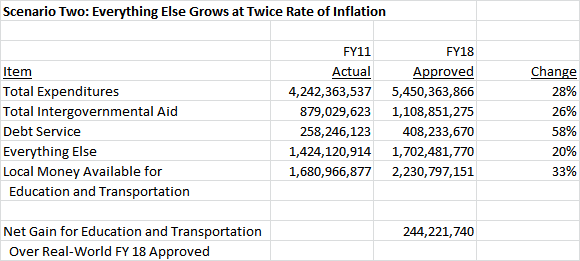
In Scenario 2, $2.2 billion is available for education and transportation, $244 million more than the real world FY18 budget.

For the sake of comparison to both of these scenarios, let’s recall that the 9 percent property tax hike was supposed to raise $140 million a year.  (It probably raised a little less than that.)  So under both scenarios, the county could have avoided the giant tax hike and still had lots of money left over for more education and transportation spending.

Yes folks, we understand the radical nature of what we are proposing – namely that liberal Democrats should deliberately and strategically restrain the growth in some forms of spending to boost growth in other spending.  This is likely to be an unpopular concept in a county that has multiple jam-packed budget hearings every year with groups of all kinds requesting money.  But here’s the benefit to concentrating on education and transportation: both forms of spending are investments that generate returns for the economy.  And when those returns boost economic growth, they generate tax revenue that bolsters the entire budget.

What is necessary to pull this off?  Simply put, this requires strategy, discipline, patience and leadership.  Without those traits, given the huge number of constituencies that want their piece of the budget, it would be impossible to focus it on education and transportation.  The natural outcome of a budget process without strategy is that everything gets funded, a tax hike follows, voters tire of it and then they pass restrictive charter amendments and vote for politicians like Larry Hogan.

So what are we going to get?  Spending on everything followed by tax hikes?  Or a budget that is strategically focused on generating economic returns from education and transportation?

Folks, that depends on your decisions in the voting booth.

Share

Why Progressives Need Economic Growth

By Adam Pagnucco.

For progressives, few issues should be more important than the need for economic growth.  Why do we say that?  First, let’s see what happens when there is no growth.

We have previously written about what happened to the county budget during the Great Recession but we may not have done it justice.  During that time, the evaporation of revenue required the county to implement a series of huge cuts.  Consider what happened to this sample of programs during the recession’s three worst budget years.

These programs are the very essence of the best of progressivism: protecting people from discrimination, funding arts and humanities, paying for community grants to non-profits, helping those with special needs and creating affordable housing.  All were gutted during the recession.

Believe it or not, the above understates the impact of revenue absence.  Consider county employees.  Their collective bargaining agreements were broken and they went without raises for three straight years.  In FY11, they were furloughed.  In FY12, their benefits were cut.  MCPS employees were not immune as the county cut its local contribution per pupil for three straight years.

Perhaps cruelest of all was the county’s cut in its local earned income tax credit (EITC).  MoCo is one of the few counties in the U.S. that has its own EITC and it was once set to match the state’s credit under county law.  During the recession, the county changed its law to allow its EITC to vary and it was cut by almost a third.  How bad is it to cut a tax credit for the working poor during a recession?  Your author’s former employer, Council Member Hans Riemer, later introduced a bill to restore the EITC to its full amount.  After a tremendous fight, he passed it.

We don’t intend to criticize the County Executive or the County Council for making these cuts.  The economy went south and they didn’t have any money.  That’s the whole point here: without economic growth there is no money.

We are no longer in a recession but revenue growth is not as strong as it once was.  Consider the history of county revenue growth, excluding intergovernmental aid, since FY98.  Red bars in the chart below refer to years in which tax increases were levied.

From FY98 through FY09, revenue growth excluding intergovernmental aid rose by an annual average of 6.1%.  In the years since, it has grown by just 2.7% a year – and that includes the year in which the county implemented a 9% property tax hike.  The County Executive’s recommended FY19 budget includes a scant 1.3% growth in revenue excluding intergovernmental aid.  How much more spending on progressive programs can be financed with that?

It’s not a coincidence that the slow years for revenue overlap with the years in which county employment has barely grown, higher-paying wage and salary jobs are being replaced by lower-paying self-employment, business formation has flat-lined and taxpayer income outmigration has hit record levels.  Stagnant revenues are a result of a stagnant economy.

This dynamic is playing out right now.  Some on the County Council would like to expand pre-k education, a huge progressive priority and a great idea.  The problem is that it would cost – at minimum – tens of millions of dollars to be meaningful.  And when the county is already relying on tens of millions of dollars in employee and retiree health insurance money just to fund its current budget, there is no way that’s going to happen.

Tax revenue is the fuel in the engine of progressivism.  That’s because nearly everything that progressives want to do costs money, like funding schools, colleges, youth programs, senior services, social workers, support for vulnerable people, affordable housing and the like.  Conservatives don’t have this problem.  They think government is incompetent at best or evil at worst, so in their view, money given to government is bound to be wasted.  Progressives actually need tax revenue from economic growth MORE than conservatives do because it is essential to the success of their policy agenda.

Here’s the bottom line: you can’t say you’re a progressive and then oppose the growth in tax base needed to pay for a progressive agenda.  Any candidate with that position will be unable to implement progressive priorities if elected.

Progressives need economic growth.  Because without it, they can’t be very progressive at all.

Share

This Type of Employment is Growing Rapidly in MoCo

By Adam Pagnucco.

Data from the U.S. Bureau of Economic Analysis (BEA) confirms something we have reported before: wage and salary employment has been stagnant in MoCo for a decade.  But BEA data indicates something else is happening too: proprietor (self-employed) employment has been growing rapidly here and it pays less than wage and salary jobs.  That may not be a great sign for the county’s economy.

Unlike the U.S. Bureau of Labor Statistics (BLS), which we have cited in the past, BEA tracks two kinds of employment: wage and salary and proprietors.  (Check here for a summary of methodological differences between the two agencies.)  Proprietors are self-employed and operate through sole proprietorships (integrated with their personal income on their income tax returns), partnerships and tax-exempt cooperatives.  According to the Census Bureau’s Survey of Business Owners program, less than one in five of MoCo’s businesses have paid employees.  The county has a lot of self-employed people and little is said about them.

Here is the change in wage and salary employment between 2006 and 2016 for the seventeen Washington area jurisdictions tracked by BEA.

This data tells a similar story to BLS data we have previously presented: MoCo has trailed most of the region in job creation over the last decade.  Only Alexandria City and tiny Clarke County, VA have fared worse.

However, proprietor job data tells a much different story.  MoCo’s rate of proprietor job creation (36% over the last decade) is almost identical to the region as a whole.

Proprietor jobs aren’t inherently bad and it’s good that MoCo has SOME kind of employment growth.  But proprietors have much less security than full-time wage and salary workers.  Proprietors have sole responsibility for their health and retirement benefits and many of them have little cushion when contracts and/or clients dry up.  They also make less.  In 2016, the average wage and salary plus employer contribution to pensions, insurance and government social insurance totaled $89,337 per wage and salary employee in MoCo.  By contrast, the average earnings per proprietor totaled $66,498.

This isn’t happening just in MoCo; it’s a regional phenomenon.  But MoCo is an outlier.  The chart below compares wage and salary job creation and proprietor job creation by D.C. area jurisdiction between 2006 and 2016.  In the region as a whole, 1.2 proprietor jobs have been created for every wage and salary job over the last decade.  MoCo led the entire region in proprietor job creation with 53,672 jobs – a 36% growth rate.  But MoCo was one of the worst performers in creating wage and salary jobs as one of just three jurisdictions with an absolute job loss.  The result is a significant shift in MoCo away from wage and salary employment towards lower-paying contingent employment by a magnitude not seen in most of the rest of the region.

Unemployment rates don’t capture this kind of labor market shift.  If a self-employed person working on contracts is not seeking a full-time job even if they would like one, that person will not be counted as unemployed.

Proprietor growth can be a good thing if it reflects job-creating entrepreneurship.  That might be the case in places like Loudoun, D.C., Arlington, Fairfax and Prince William, all of which saw simultaneous increases in both proprietor and wage and salary employment.  It’s possible in those jurisdictions that new proprietorships created wage and salary jobs.  But MoCo is different from the above five places.  Here, surging proprietorships coincided with stagnant wage and salary employment.  Since proprietor jobs pay less on average, that may not be a good thing.

Let’s put this together with our previous work on the county’s economy.  MoCo business formation has slowed to a halt.  Private sector employers in the county have (at least through 2016) not restored their job counts above pre-recession levels.  These factors have contributed to big budget shortfalls, a nine percent property tax hike and county usage of one-time transfers to balance the budget.  Those MoCo taxpayers who have chosen to move out have higher incomes than those who are moving in.  And in MoCo, lower paying self-employment is outgrowing higher paying wage and salary employment.

Voters, take heed.

Share

Marc Elrich: “I Prefer to Put Jobs in Frederick”

By Adam Pagnucco.

Yesterday, Greater Greater Washington (GGW) wrote a long essay about Council Member Marc Elrich, who is running for Executive.  GGW has many disagreements with Elrich about smart growth and housing and mostly concentrated on those issues.  But the essay contained this quote from an interview with Elrich.

Broadly, Elrich isn’t convinced Montgomery County needs to add many new homes or residents, or jobs. Many people with jobs in Bethesda or DC are now living in Frederick County and other outlying areas and driving through Montgomery to get to work. We asked Elrich what he’d do for these folks, and his answer was, “I prefer to put jobs in Frederick.” He’d encourage the growth of both households and jobs to happen there, and in Prince George’s County, and elsewhere.

Elrich has disputed quotes before and we will see if he disputes this one.  But if the quote is accurate… well.

The chart below uses data from the U.S. Bureau of Labor Statistics (BLS) to compare growth in total employment in Frederick and MoCo from 2001 through 2016.

Frederick’s job creation record is clearly better than MoCo’s in both absolute and relative terms.

Now let’s use BLS data to compare growth in establishment counts in the two counties.

Frederick beats MoCo in growth rate and, over the last decade, in net new establishment count too.

Let’s bear in mind the relative size of the two counties.  Frederick has about a quarter of MoCo’s population.  Yet, Frederick has created a larger absolute number of jobs over the last fifteen years than MoCo and had a net gain since 2006 while MoCo had a net loss.  In terms of establishments, Frederick created more than double what MoCo did over the last decade despite being much smaller.

Now let’s recall the research we did three weeks ago on taxpayer migration.  MoCo is often compared to Fairfax, but the truth is that we have lost more taxpayer income to Frederick than to Fairfax over the last decade.

Between 2006 and 2016, MoCo had a net outmigration of $582 million in real adjusted gross income to Frederick.

The greatest losses to Frederick occurred during MoCo’s home price boom of 2002 through 2007.  MoCo home prices are rising again so let’s connect the economic dots.  Suppose we cut off housing construction in the ways Elrich described to Greater Greater Washington.  Unless there is a recession – which would bring a different set of problems – a housing shutdown in MoCo would cause more home price and rent hikes, exacerbating our already oppressive cost of living and pushing some folks into Frederick.  Once in Frederick, some of those people would start businesses, hire people and create more economic activity there.  That’s great for Frederick and it’s part of the explanation for the growth they have seen in the last fifteen years.  But what exactly does that do for us?

Look, folks – with surging needs in schools, transportation and everything else and with maxed out county debt, we have a lot of bills to pay.  There are two ways to do it.  Option one is to grow our commercial tax base and create jobs, thereby generating more tax revenue.  Option two is more big tax hikes which will further strain the cost of living.

If we have a County Executive who is fighting to put jobs in Frederick and NOT in MoCo, which option do you think our county will pick?

Disclosure: the author supports Roger Berliner for Executive.

Share

Taxpayer Flight from MoCo, Part Five

By Adam Pagnucco.

Today, we conclude looking at jurisdictions with whom MoCo has had inflows and outflows of tax returns and adjusted gross incomes.

Loudoun County

Net change in tax returns, 2006-2016: -1,507 (outflow)

Net change in adjusted gross income ($2016), 2006-2016: -$208 million (outflow)

Adjusted gross income of in-migrants ($2016), 2006-2016: $76,287

Adjusted gross income of out-migrants ($2016), 2006-2016: $100,587

Migrant income gap: Out-migrants earned 32% more than in-migrants

Loudoun has been the fastest-growing large jurisdiction in the Washington region for a long time and was once one of the fastest-growing places in the country.  Much of its growth has come from people relocating from Fairfax but it has gained some folks from MoCo too.  As the wealthiest county in the nation, it’s no surprise that its migrants from MoCo skew to high earners.

Howard County

Net change in tax returns, 2006-2016: -2,859 (outflow)

Net change in adjusted gross income ($2016), 2006-2016: -$400 million (outflow)

Adjusted gross income of in-migrants ($2016), 2006-2016: $72,231

Adjusted gross income of out-migrants ($2016), 2006-2016: $90,724

Migrant income gap: Out-migrants earned 26% more than in-migrants

Howard is MoCo’s smaller and wealthier neighbor to the northeast.  It gains relatively small amounts from MoCo every year but set a record in 2016, when $131 million of taxpayer income left MoCo for Howard.  Howard’s schools and quality of life are comparable to MoCo but its significant distance from D.C. has limited its ability to compete for people who work downtown.  Ironically, the joint bus rapid transit route on US-29 that MoCo is working on with Howard could help remedy that disadvantage. 

Fairfax County

Net change in tax returns, 2006-2016: -2,382 (outflow)

Net change in adjusted gross income ($2016), 2006-2016: -$497 million (outflow)

Adjusted gross income of in-migrants ($2016), 2006-2016: $70,796

Adjusted gross income of out-migrants ($2016), 2006-2016: $93,521

Migrant income gap: Out-migrants earned 32% more than in-migrants

Fairfax has had more taxpayer flight than MoCo overall and is losing a ton of income to Loudoun ($2.5 billion over the last decade).  But in head-to-head competition, Fairfax siphons millions in taxpayer income from MoCo every year, setting a record in 2013 with a net gain of $112 million.  A big reason for Fairfax’s gains is that the people who move from MoCo to Fairfax made 32% more money than those who moved in the opposite direction over the last decade. 

Frederick County

Net change in tax returns, 2006-2016: -7,170 (outflow)

Net change in adjusted gross income ($2016), 2006-2016: -$582 million (outflow)

Adjusted gross income of in-migrants ($2016), 2006-2016: $59,150

Adjusted gross income of out-migrants ($2016), 2006-2016: $69,017

Migrant income gap: Out-migrants earned 17% more than in-migrants

MoCo’s smaller neighbor to the north has been feeding off the county for years.  Frederick’s biggest gains from MoCo occurred from 2002 through 2007 during the latter’s housing price boom.  Frederick is not siphoning off anywhere near the amount of income that Loudoun is getting from Fairfax, but the inflow of people from MoCo has helped change its county seat’s downtown, its demographics  and its politics.

Virginia

Net change in tax returns, 2006-2016: -5,638 (outflow)

Net change in adjusted gross income ($2016), 2006-2016: -$851 million (outflow)

Adjusted gross income of in-migrants ($2016), 2006-2016: $70,701

Adjusted gross income of out-migrants ($2016), 2006-2016: $83,010

Migrant income gap: Out-migrants earned 17% more than in-migrants

MoCo has lost significant amounts to Virginia over the years, with the biggest income losses occurring in 2013 ($152 million) and 2012 ($109 million).  Fairfax is the biggest culprit, followed by Loudoun and the rest of Northern Virginia.  The pace of income lost has picked up considerably since the early 1990s.

Florida

Net change in tax returns, 2006-2016: -2,769 (outflow)

Net change in adjusted gross income ($2016), 2006-2016: -$907 million (outflow)

Adjusted gross income of in-migrants ($2016), 2006-2016: $70,112

Adjusted gross income of out-migrants ($2016), 2006-2016: $132,459

Migrant income gap: Out-migrants earned 89% more than in-migrants

Everyone has heard the stories of rich people and/or retirees moving from MoCo to Florida.  Well, those stories might be true: more MoCo income has been lost to Florida than to Virginia over the last decade.  The number of people moving to Florida is less than those moving to Virginia.  But the average income of those moving from MoCo to Florida – $132,459 – is large in both absolute terms and when compared to those moving in reverse ($70,112).  One more thing: the last four years saw the biggest net loss of taxpayer income to Florida ($552 million) of any four-year period on record.

Share

Taxpayer Flight from MoCo, Part Four

By Adam Pagnucco.

In Part Three, we saw that MoCo’s problem of taxpayer flight is shared by most jurisdictions in the Washington region.  But what happens when we look at MoCo’s taxpayer inflows and outflows to and from each of its large neighbors?  From whom does MoCo gain income on net?  And to whom does MoCo lose income on net?

We looked at net gains and losses between MoCo and nine other local jurisdictions plus two states.  Let’s start with the two jurisdictions from which MoCo has net gains of taxpayer income: D.C. and Prince George’s.

District of Columbia

Net change in tax returns, 2006-2016: +1,070 (inflow)

Net change in adjusted gross income ($2016), 2006-2016: +$417 million (inflow)

Adjusted gross income of in-migrants ($2016), 2006-2016: $94,696

Adjusted gross income of out-migrants ($2016), 2006-2016: $83,038

Migrant income gap: In-migrants earned 12% more than out-migrants

MoCo almost always drains tens of millions of dollars in taxpayer income each year from D.C.  That’s because it gets more in-migrants from D.C. than out-migrants and the in-migrants make more.  This fits a pattern of young people living in D.C. and then moving to the suburbs as their incomes grow and they are ready to have kids.  However, as D.C.’s economy has improved since the 1990s, the District’s net income flow to MoCo has diminished over time.  In 2015, D.C. even netted a gain of $40 million from MoCo, the first time the District ended up on the plus side of this ledger since this data series began in 1993.

Prince George’s County

Net change in tax returns, 2006-2016: +834 (inflow)

Net change in adjusted gross income ($2016), 2006-2016: +$39 million (inflow)

Adjusted gross income of in-migrants ($2016), 2006-2016: $42,894

Adjusted gross income of out-migrants ($2016), 2006-2016: $42,802

Migrant income gap: In-migrants earned about the same as out-migrants

In the 1990s, MoCo consistently enjoyed positive income inflows from Prince George’s, but that began to change in the 2000s.  In the last fifteen years, MoCo lost money to Prince George’s seven times.  MoCo may still have a slight advantage but it’s very tenuous and could slip away.

Alexandria City

Net change in tax returns, 2006-2016: -346 (outflow)

Net change in adjusted gross income ($2016), 2006-2016: -$7 million (outflow)

Adjusted gross income of in-migrants ($2016), 2006-2016: $78,961

Adjusted gross income of out-migrants ($2016), 2006-2016: $73,304

Migrant income gap: In-migrants earned 7% more than out-migrants

There’s not a ton of migration between MoCo and Alexandria and the two jurisdictions roughly break even, although MoCo’s balance has deteriorated a bit in recent years.

Arlington County

Net change in tax returns, 2006-2016: -1,103 (outflow)

Net change in adjusted gross income ($2016), 2006-2016: -$8 million (outflow)

Adjusted gross income of in-migrants ($2016), 2006-2016: $85,154

Adjusted gross income of out-migrants ($2016), 2006-2016: $72,852

Migrant income gap: Out-migrants earned 14% more than in-migrants

As with Alexandria, MoCo roughly breaks even with Arlington.  Again, MoCo’s balance has gotten slightly worse in recent years.

Prince William County

Net change in tax returns, 2006-2016: -289 (outflow)

Net change in adjusted gross income ($2016), 2006-2016: -$33 million (outflow)

Adjusted gross income of in-migrants ($2016), 2006-2016: $50,076

Adjusted gross income of out-migrants ($2016), 2006-2016: $57,436

Migrant income gap: Out-migrants earned 15% more than in-migrants

Prince William has received small inflows of income from MoCo that have diminished in recent years.  Most people moving between the two counties fall in the lower end of the region’s income distribution.

We will conclude tomorrow.

Share

Taxpayer Flight from MoCo, Part Three

By Adam Pagnucco.

In Part Two, we detailed how MoCo has experienced an exodus of taxpayer income since 1993.  But MoCo is not alone: many large jurisdictions in the Washington region have suffered from taxpayer flight over the last decade.

Below is a chart showing the net change in tax returns for the ten largest jurisdictions in the region.  We show net change for two time periods: the last five years (2011-2016), which include the recovery from the Great Recession, and the last ten years (2006-2016), which include the pre-recession peak, the recession itself and the recovery afterwards.  MoCo ranks nine out of ten in both periods with only Fairfax faring worse.  Loudoun is the only jurisdiction showing significant in-migration in the last five years while D.C. was comparable to Loudoun over the last ten years.

Next, we show the net change in adjusted gross income (AGI), measured in 2016 dollars, over the two periods.  Once again, MoCo is the second-worst jurisdiction in the region with only Fairfax trailing.  Notably, only Loudoun had a net inflow in the last five years and Loudoun, Prince William and Frederick had net inflows in the last ten years.

Finally, we show the average AGI of in-migrants vs the average AGI of out-migrants over the two periods.  In every jurisdiction except Loudoun (during the 2006-2016 period), in-migrant AGI was lower than out-migrant AGI.  MoCo’s gap was the third largest.

This is a bad picture for MoCo and not a very good one for the region as a whole.  What is going on here?

First, as has been previously noted by George Mason Professor Stephen Fuller, the entire Washington region’s economy has slowed down since the Great Recession.  That is reflected in the deterioration of the numbers above between the last five years and the last ten years.  The “new normal” has not been kind to anyone in this area and that includes MoCo.

Second, Fairfax has been affected by taxpayer income losses even more than MoCo.  Like MoCo, Fairfax is a huge county with huge bills to pay and nightmarish traffic congestion.  But Fairfax also shares a long land border with Loudoun, which has grown dramatically in past decades and is currently the nation’s wealthiest county.  Of the $5.9 billion that Fairfax lost to taxpayer flight in the last decade, $2.5 billion went to Loudoun.

Third, in addition to the number of taxpayers leaving on net, MoCo’s problem is the big gap in income between those coming in and those leaving.  One would expect to see such a gap in places like D.C. and Arlington, the two jurisdictions with the biggest income gaps shown above.  That’s because both places attract lots of young people who work in and near downtown D.C. and then move out when they earn more and have kids.  That explanation does not work well for MoCo, which has a much lower percentage of young people in its population than D.C. or Arlington.  And yet MoCo’s gap, which is third in the region, has been significantly bigger than the gaps in Fairfax and Howard, two jurisdictions of similar wealth, in the last five years.

We have seen how MoCo compares to its large neighbors in tax migration overall.  But what about direct inflow and outflow relationships?  To whom does MoCo lose income?  And from whom does MoCo gain income?  We will begin examining that in Part Four.

Share

Taxpayer Flight from MoCo, Part Two

By Adam Pagnucco.

As we stated in Part One, the IRS tracks the inflow and outflow of returns, exemptions and adjusted gross income (AGI) for all states and counties.  Comparable data starts in 1993 and continues through 2016.  Here is what that data looks like for Montgomery County.

First, let’s look at the inflow and outflow of tax returns, which approximate the number of households.

For most years, the number of tax returns leaving has exceeded the number of tax returns entering.  The chief exceptions have occurred during economic downturns, especially in the aftermath of the Great Recession.  We are skeptical of the data for 2015: there is no apparent explanation for the enormous drop in both inflow and outflow in that one year.  We saw those drops in every local jurisdiction we examined and they did not seem to produce huge swings in net changes, as we will see.

Below is the net change of tax returns (inflow minus outflow).

The net migration of tax returns – inflow minus outflow – tends to shrink during recessions but it is almost always negative.  Since 1993, there was only one year when inflow exceeded outflow – 2009, when tax return migration was +658.  In 2016, outflow exceeded inflow by 4,748 returns – the worst year on record.  The migration of exemptions, in and out, has followed similar patterns.

Now let’s look at the migration of adjusted gross income (AGI).  The chart below shows the total AGI of taxpayers migrating into Montgomery County and out of Montgomery County, adjusted for inflation and measured in millions of 2016 dollars.

Outflow has exceeded inflow in every year.  Note, once again, the fluky data for 2015.  Below is the net change, adjusted for inflation, in millions of 2016 dollars.

Every year has seen a net loss of adjusted gross income.  The year which came closest to a wash was 2010, when $24 million was lost.  The worst losses on record were in 2004 ($608 million), 2013 ($697 million), 2014 ($601 million) and 2016 ($672 million).  Over the five-year period of 2011 through 2016, $2.75 billion of taxpayer income left Montgomery County on net.

The IRS data tells one more story.  Thousands of taxpayers enter MoCo and thousands leave MoCo every year.  But on average, those who enter have lower adjusted gross incomes than those who leave.  The chart below shows the average AGI of in-migrants and out-migrants in 2016 dollars.

Since 1993, out-migrants have had greater adjusted gross incomes than in-migrants by an average of 14%.  In the 2011 to 2016 period, the average AGI of in-migrants was $71,707 in 2016 dollars while the average AGI of out-migrants was $83,262 – a gap of 16%.

One can only imagine the impact on the county’s budget when hundreds of millions of dollars in taxpayer income leave every year.

Montgomery County is not the only jurisdiction in the region to see a net exodus of taxpayer income.  We will examine how MoCo compares to its large neighbors in Part Three.

Share

Taxpayer Flight from MoCo, Part One

By Adam Pagnucco.

We have been printing a ton of posts about the economy on Seventh State, including discussions of our employment and income growth, our rate of business formation, our increasing reliance on corporate welfare to attract and retain employers, the role of economic growth in creating the county’s $120 million budget shortfall and reactions from County Executive candidates and gubernatorial candidate Kevin Kamenetz. Let’s be clear: as we wrote eleven years ago, without economic growth, we will not be able to meet our needs without more tax hikes in the future.  And today, we begin presenting the following facts.

More taxpayers have been leaving Montgomery County than entering it for a long time.

The taxpayers who are coming in make less money than the ones who are leaving.

And while this has been going on for decades, it is now worse than it has ever been.

Our basis for these statements is a data series on tax migration maintained by the Internal Revenue Service (IRS).  As the IRS explains:

Migration data for the United States are based on year-to-year address changes reported on individual income tax returns filed with the IRS. They present migration patterns by State or by county for the entire United States and are available for inflows—the number of new residents who moved to a State or county and where they migrated from, and outflows—the number of residents leaving a State or county and where they went. The data are available for Filing Years 1991 through 2016 and include:

  • Number of returns filed, which approximates the number of households that migrated

  • Number of personal exemptions claimed, which approximates the number of individuals

  • Total adjusted gross income, starting with Filing Year 1995

  • Aggregate migration flows at the State level, by the size of adjusted gross income (AGI) and age of the primary taxpayer, starting with Filing Year 2011.

For every state and county in the U.S., the IRS tracks both inflow and outflow of returns, exemptions and adjusted gross income.  But that’s not all: the IRS reports the origin and destination jurisdictions of these flows.  So data users can see a situation in which County X has a net inflow overall but has a net inflow from County Y and a net outflow to County Z.  The directions of these flows, in an out, become apparent when the data is downloaded and crunched.

Over the next few days, we will publish the following statistics.

Montgomery County’s inflows and outflows of returns and adjusted gross income from 1993 (the first year in which comparable data is available) to 2016.

Inflow and outflow statistics for MoCo and its large neighbors – D.C., Frederick, Howard, Prince George’s, Alexandria, Arlington, Fairfax, Loudoun and Prince William – to provide perspective.

A listing of destination and origin jurisdictions of taxpayer migration between MoCo and its neighbors.  This will identify MoCo’s comparative advantages and disadvantages in taxpayer flow across the region.

Tomorrow, we will proceed.

Share