Today, I look at forecasts for MetroRail and MetroBus for the two most recent comparable periods with available data. In the period from July 2017 through March 2018, MetroRail forecasts were above projections in four months and below in five months.
This doesn’t sound too bad until one examines the overall numbers. Metro overestimated ridership for these nine months by nearly 2.8 million. Actual ridership was 2.1% lower than expected by WMATA in its budget forecasts.
On the good news front, the rail ridership forecasts were not as off as the previous year.
In July 2016 through March 2017, WMATA overestimated rail ridership every single month, resulting in a net overestimate of 19.4 million or 13.0%. However, though WMATA projections are less wildly optimistic, notice that the skew direction remains the same.
The improvement was less strong in MetroBus ridership forecasts and the skew direction remained overly rosy. Here are the projected and actual MetroBus ridership for the most recent period.
WMATA projected more MetroBus riders every month than expected with the projections worse in the most recent months. Overall, there were nearly 4.5 million, or 5.1%, fewer riders than anticipated by the budget forecasts.
Like for MetroRail, the previous year’s MetroBus projections were abysmal.
The previous year’s projections were off by even more in every single month. WMATA overestimated MetroBus ridership by 9.3 million. Actual ridership was 9.2% lower than the forecast.
WMATA needs to reform its projections so they do not skew in favor of overestimating ridership. Indeed, if anything, it would be better to err on the conservative side since Metro’s budget relies in part on the expected collection of fares related to these projections.
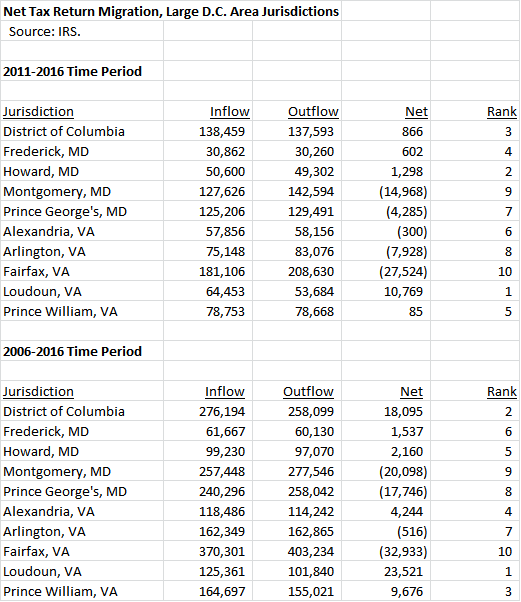
In Part Two, we detailed how MoCo has experienced an exodus of taxpayer income since 1993. But MoCo is not alone: many large jurisdictions in the Washington region have suffered from taxpayer flight over the last decade.
Below is a chart showing the net change in tax returns for the ten largest jurisdictions in the region. We show net change for two time periods: the last five years (2011-2016), which include the recovery from the Great Recession, and the last ten years (2006-2016), which include the pre-recession peak, the recession itself and the recovery afterwards. MoCo ranks nine out of ten in both periods with only Fairfax faring worse. Loudoun is the only jurisdiction showing significant in-migration in the last five years while D.C. was comparable to Loudoun over the last ten years.
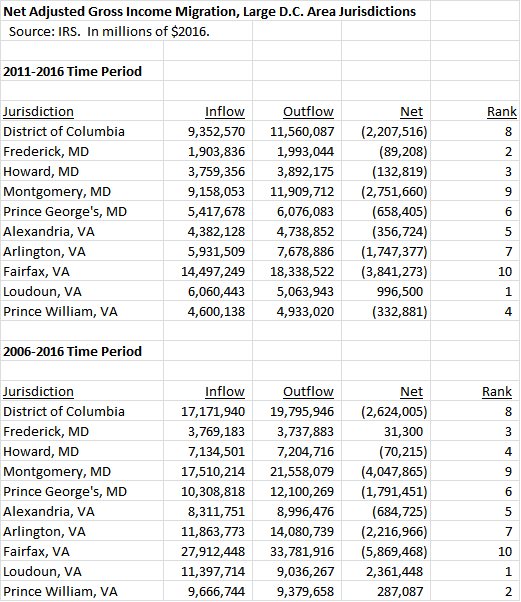
Next, we show the net change in adjusted gross income (AGI), measured in 2016 dollars, over the two periods. Once again, MoCo is the second-worst jurisdiction in the region with only Fairfax trailing. Notably, only Loudoun had a net inflow in the last five years and Loudoun, Prince William and Frederick had net inflows in the last ten years.
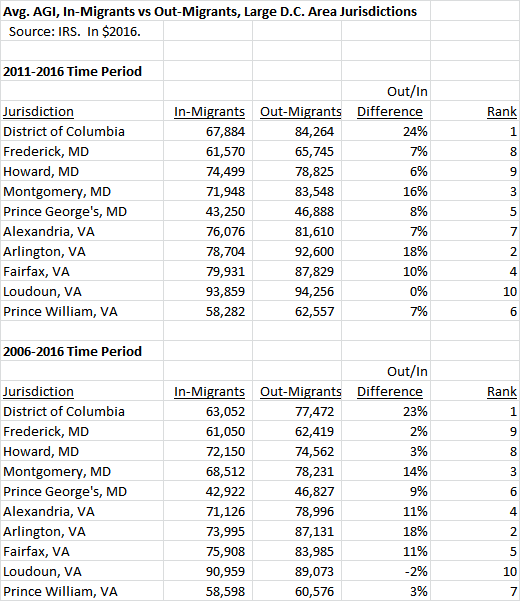
Finally, we show the average AGI of in-migrants vs the average AGI of out-migrants over the two periods. In every jurisdiction except Loudoun (during the 2006-2016 period), in-migrant AGI was lower than out-migrant AGI. MoCo’s gap was the third largest.
This is a bad picture for MoCo and not a very good one for the region as a whole. What is going on here?
First, as has been previously noted by George Mason Professor Stephen Fuller, the entire Washington region’s economy has slowed down since the Great Recession. That is reflected in the deterioration of the numbers above between the last five years and the last ten years. The “new normal” has not been kind to anyone in this area and that includes MoCo.
Second, Fairfax has been affected by taxpayer income losses even more than MoCo. Like MoCo, Fairfax is a huge county with huge bills to pay and nightmarish traffic congestion. But Fairfax also shares a long land border with Loudoun, which has grown dramatically in past decades and is currently the nation’s wealthiest county. Of the $5.9 billion that Fairfax lost to taxpayer flight in the last decade, $2.5 billion went to Loudoun.
Third, in addition to the number of taxpayers leaving on net, MoCo’s problem is the big gap in income between those coming in and those leaving. One would expect to see such a gap in places like D.C. and Arlington, the two jurisdictions with the biggest income gaps shown above. That’s because both places attract lots of young people who work in and near downtown D.C. and then move out when they earn more and have kids. That explanation does not work well for MoCo, which has a much lower percentage of young people in its population than D.C. or Arlington. And yet MoCo’s gap, which is third in the region, has been significantly bigger than the gaps in Fairfax and Howard, two jurisdictions of similar wealth, in the last five years.
We have seen how MoCo compares to its large neighbors in tax migration overall. But what about direct inflow and outflow relationships? To whom does MoCo lose income? And from whom does MoCo gain income? We will begin examining that in Part Four.
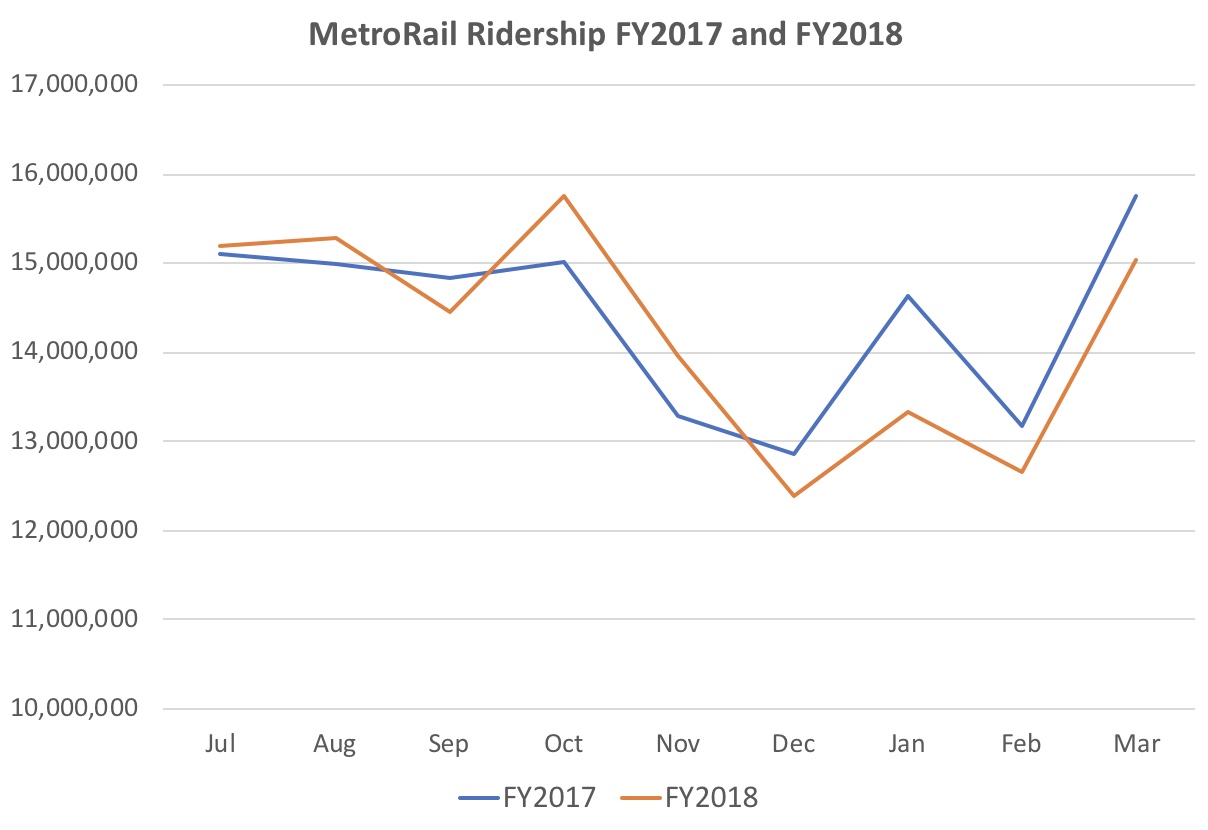
Today, I’ve put together MetroRail and MetroBus ridership over the same period from July though March for FY2017 and FY2018.
Among the nine months with comparable data, MetroRail ridership was up over the previous year in four months and down in five months. The months with decline, especially January, saw overall greater slump than the months with gain.
As a result, MetroRail ridership for more recent period is a net 1.57 million lower, or 1.2%, over the previous year. Metro should find this very discouraging. SafeTrack ended, at least temporarily, in June 2017, so the current year is completely post-SafeTrack. Its completion along with the “Back to Good” campaign has simply not halted the long-term hemorrhage.
Moreover, one can hardly blame the decline from December through March on a brutal winter this year. This planned closing of stations in summer from 2018 through 2021 for weeks on end doesn’t seem likely to help matters either.
If you think the rail numbers are somewhat discouraging, take a look at the bus numbers.
MetroBus ridership is off by 8.6 million (!) over the previous year, an incredible decline 9.4%. No month saw a year-to-year increase. Declines in ridership impact Metro’s budget, as it depends on fares to provide a significant portion of its budget.
Data Sources: Vital Signs Report (Q1-2017), p. 21; Metro Performance Report (Q3-2018), p. 40.
As we stated in Part One, the IRS tracks the inflow and outflow of returns, exemptions and adjusted gross income (AGI) for all states and counties. Comparable data starts in 1993 and continues through 2016. Here is what that data looks like for Montgomery County.
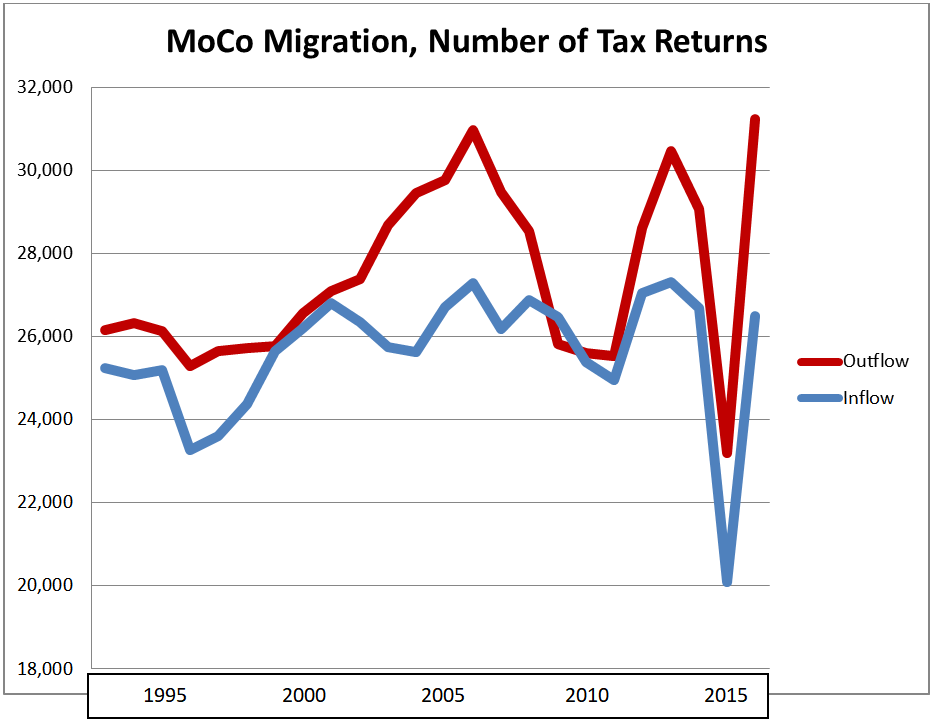
First, let’s look at the inflow and outflow of tax returns, which approximate the number of households.
For most years, the number of tax returns leaving has exceeded the number of tax returns entering. The chief exceptions have occurred during economic downturns, especially in the aftermath of the Great Recession. We are skeptical of the data for 2015: there is no apparent explanation for the enormous drop in both inflow and outflow in that one year. We saw those drops in every local jurisdiction we examined and they did not seem to produce huge swings in net changes, as we will see.
Below is the net change of tax returns (inflow minus outflow).
The net migration of tax returns – inflow minus outflow – tends to shrink during recessions but it is almost always negative. Since 1993, there was only one year when inflow exceeded outflow – 2009, when tax return migration was +658. In 2016, outflow exceeded inflow by 4,748 returns – the worst year on record. The migration of exemptions, in and out, has followed similar patterns.
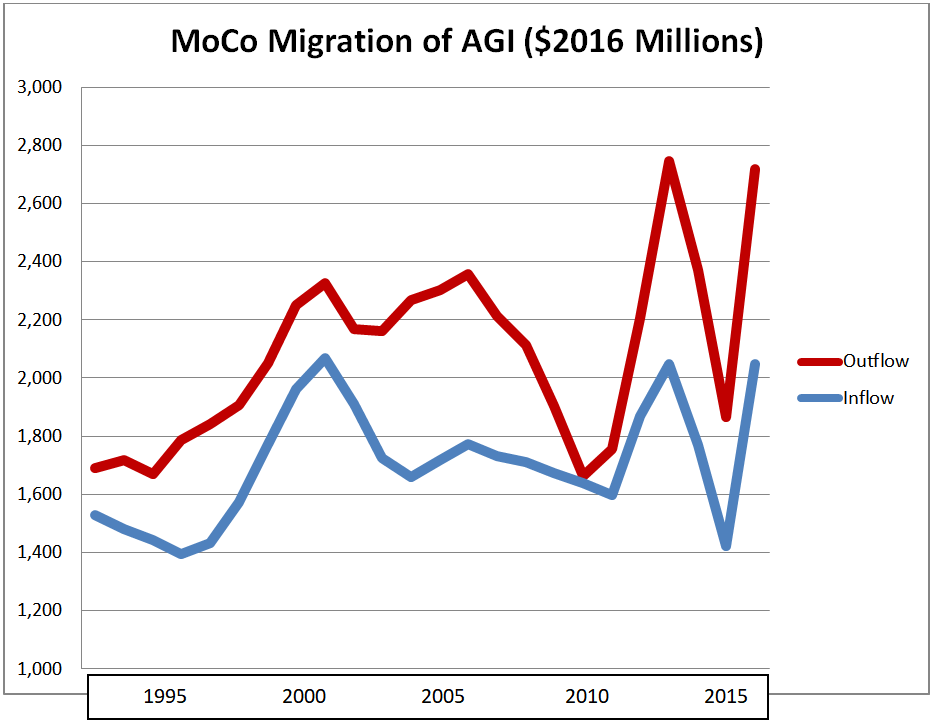
Now let’s look at the migration of adjusted gross income (AGI). The chart below shows the total AGI of taxpayers migrating into Montgomery County and out of Montgomery County, adjusted for inflation and measured in millions of 2016 dollars.
Outflow has exceeded inflow in every year. Note, once again, the fluky data for 2015. Below is the net change, adjusted for inflation, in millions of 2016 dollars.
Every year has seen a net loss of adjusted gross income. The year which came closest to a wash was 2010, when $24 million was lost. The worst losses on record were in 2004 ($608 million), 2013 ($697 million), 2014 ($601 million) and 2016 ($672 million). Over the five-year period of 2011 through 2016, $2.75 billion of taxpayer income left Montgomery County on net.
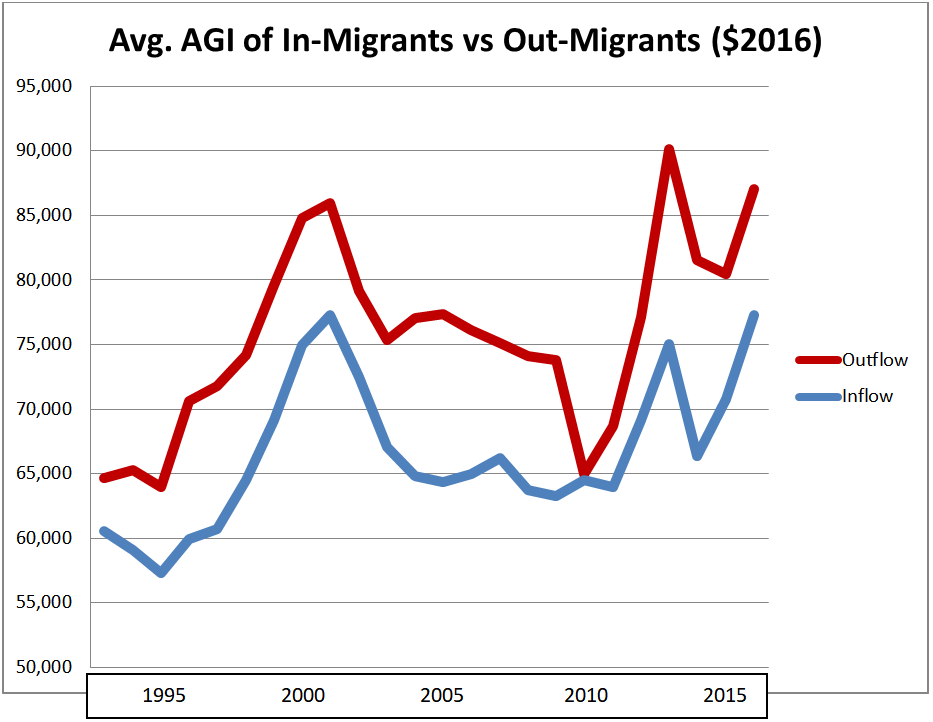
The IRS data tells one more story. Thousands of taxpayers enter MoCo and thousands leave MoCo every year. But on average, those who enter have lower adjusted gross incomes than those who leave. The chart below shows the average AGI of in-migrants and out-migrants in 2016 dollars.
Since 1993, out-migrants have had greater adjusted gross incomes than in-migrants by an average of 14%. In the 2011 to 2016 period, the average AGI of in-migrants was $71,707 in 2016 dollars while the average AGI of out-migrants was $83,262 – a gap of 16%.
One can only imagine the impact on the county’s budget when hundreds of millions of dollars in taxpayer income leave every year.
Montgomery County is not the only jurisdiction in the region to see a net exodus of taxpayer income. We will examine how MoCo compares to its large neighbors in Part Three.
As part of its campaign against Senate President Mike Miller, SEIU Local 500 has endorsed eleven State Senate candidates whom it believes will “change the leadership in the State Senate and, most importantly, change the way things are done in the legislature.” One of the candidates is Tommi Makila, Miller’s primary election opponent. The union has previously announced its support for some of these candidates, like Dana Beyer in District 18 and its own member, Aletheia McCaskill, in District 44. We reprint the union’s press release below.
*****
For Immediate Release
May 7, 2018
Contact: Christopher Honey honeyc@seiu500.org,
SEIU Local 500 Endorses eleven “Take a Hike Mike” Candidates Union is supporting candidates that support new leadership in Annapolis
(Gaithersburg, MD) Today, Service Employees International Union Local 500 announces it has selected its initial eleven candidates across the State of Maryland whom they believe will go to Annapolis and change the leadership in the State Senate and, most importantly, change the way things are done in the legislature.
“We need to elect people who will stand up against the status quo in the State Senate. That is why, today we are announcing our support for a team of Senate candidates who will do what it takes to get the people’s business done” said Merle Cuttitta, President of SEIU Local 500.
“We will be supporting this team of candidates with our trademark boots on the ground, digital, paid mail and earned media. We intend to send the message loud and clear that a vote for these candidates is a vote for progress in Annapolis,” added President Cuttitta.
The following candidates are being endorsed today:
District 10 (Baltimore County) – Rob Johnson
District 11 (Baltimore County) – Sheldon Laskin
District 18 (Montgomery County) – Dr. Dana Beyer
District 23 (Prince Georges County) – Tim Adams
District 25 (Prince Georges County) – Delegate Angela Angel
District 27 (Prince Georges, Calvert and Charles Counties) – Tommi Makila
District 40 (Baltimore City) – Delegate Antonio Hayes
District 41 (Baltimore CIty) Senator Jill Carter
District 43 (Baltimore City) Delegate Mary Washington
District 44 (Baltimore City and County) – Aletheia McCaskill
District 45 (Baltimore City) – Delegate Cory McCray
One of the more remarkable things occurring in MoCo this cycle is the snowballing of progressive groups around District 3 County Council challenger Ben Shnider. Just look at our latest endorsement chart. Shnider, who was virtually unknown a year ago, has collected about as many progressive endorsements as much better known politicians like Council Members Hans Riemer and Nancy Navarro, Delegate Ana Sol Gutierrez (running for Council District 1) and Council At-Large candidate Will Jawando. That’s a challenge for Shnider’s opponent, incumbent Council Member Sidney Katz, but it’s a challenge for the progressive groups too.
Sidney Katz is an odd target for progressives – and basically anyone else. Consider this: he has been an elected official at the municipal or county levels for forty years and no one dislikes him. Generations of Gaithersburg residents think of him as Dad, an uncle or Grandpa. No one would paint him as a conservative – for Heaven’s sake, he voted for a nine percent property tax hike along with the rest of the council two years ago. He has also voted for nearly every other progressive initiative passed by the council, including more school funding, more non-profit support, bills establishing sick leave and parental leave and almost everything else.
But there is one glaring exception: Katz was one of four Council Members who voted against the 2016 minimum wage bill which was then vetoed by County Executive Ike Leggett. That bill had incredible symbolic importance for many of MoCo’s liberal groups, who viewed it as a litmus test for determining which elected officials were true progressives. Katz’s efforts to forge a compromise and get a different version of the bill passed later did not mollify the left. For them, the damage was done. And someone’s head had to roll. But whose?
Four Council Members – Katz, Roger Berliner, Nancy Floreen and Craig Rice – voted against the first bill and Leggett vetoed it. Leggett and Floreen are term-limited and retiring. Rice has only token opposition in his Democratic primary. Berliner is running for Executive, an election in which progressive groups would be aligned with minimum wage lead-sponsor Marc Elrich regardless of the bill vote. That left Katz, the only opponent of the original bill against whom the left had a clear shot. And in Ben Shnider, the left has a challenger who is appealing, smart, hard-working, experienced in campaigns and an unquestioned progressive.
SEIU Local 500, a lead player in advocating for minimum wage hikes at the state and county levels, was the first major progressive group to endorse Shnider. Many more followed, including SEIU Locals 32BJ (janitors) and 1199 (health care), Progressive Maryland, the Laborers, Casa in Action, the teachers and more. The Sierra Club’s endorsement of Shnider was probably connected to another vote of Katz’s, this time against a bill banning pesticides. Katz is supported by the police and fire fighters unions, the volunteer fire fighters and the apartment and office building owners. MCGEO is the largest progressive group to not yet weigh in.
Shnider pressures Katz on the minimum wage bill.
Knocking off an incumbent is not easy. Indeed, only one Democratic district council incumbent has been defeated since the County Council’s current structure was established in 1990 and that happened twenty years ago. In the last six times that a Democratic district council incumbent was challenged, the incumbent won by 50 or more points five times.
Ben Shnider has nothing to lose by challenging Katz. He is running a tremendous campaign and has built great relationships with the left and the smart growth community. If he loses, he could very well come back to win another election as so many other MoCo politicians have. Win or lose, Shnider will be just fine.
But what about these progressive groups? The fact that so many of them have endorsed Shnider has MoCo’s political community watching this race – especially the county’s elected officials. The left will have many priorities in the next term and some will cost serious money and political capital. If these groups actually knock off Katz – or come close – then no one will want to run afoul of them in the future. But if they do nothing other than allow Shnider to use their logos and Katz wins big, they will look weak. Other elected officials will think, “They can’t hurt me so I can do what I want.” Let’s remember that for most politicians, the main thing on their minds is ALWAYS whether a group can help them or hurt them. If you can’t do either, you just don’t matter.
The progressives are making a big gamble by targeting Sidney Katz. For their sake, it better pay off.
More taxpayers have been leaving Montgomery County than entering it for a long time.
The taxpayers who are coming in make less money than the ones who are leaving.
And while this has been going on for decades, it is now worse than it has ever been.
Our basis for these statements is a data series on tax migration maintained by the Internal Revenue Service (IRS). As the IRS explains:
Migration data for the United States are based on year-to-year address changes reported on individual income tax returns filed with the IRS. They present migration patterns by State or by county for the entire United States and are available for inflows—the number of new residents who moved to a State or county and where they migrated from, and outflows—the number of residents leaving a State or county and where they went. The data are available for Filing Years 1991 through 2016 and include:
Number of returns filed, which approximates the number of households that migrated
Number of personal exemptions claimed, which approximates the number of individuals
Total adjusted gross income, starting with Filing Year 1995
Aggregate migration flows at the State level, by the size of adjusted gross income (AGI) and age of the primary taxpayer, starting with Filing Year 2011.
For every state and county in the U.S., the IRS tracks both inflow and outflow of returns, exemptions and adjusted gross income. But that’s not all: the IRS reports the origin and destination jurisdictions of these flows. So data users can see a situation in which County X has a net inflow overall but has a net inflow from County Y and a net outflow to County Z. The directions of these flows, in an out, become apparent when the data is downloaded and crunched.
Over the next few days, we will publish the following statistics.
Montgomery County’s inflows and outflows of returns and adjusted gross income from 1993 (the first year in which comparable data is available) to 2016.
Inflow and outflow statistics for MoCo and its large neighbors – D.C., Frederick, Howard, Prince George’s, Alexandria, Arlington, Fairfax, Loudoun and Prince William – to provide perspective.
A listing of destination and origin jurisdictions of taxpayer migration between MoCo and its neighbors. This will identify MoCo’s comparative advantages and disadvantages in taxpayer flow across the region.
That’s the title of the mailer sent out by Council District 1 candidate Meredith Wellington this week, which we reprint below. The remainder of Wellington’s message is clearly directed at opponents of development, an ancient political tradition in MoCo. But here is the thing: whether it’s fair or not – and we could make a case either way – pretty much everyone we talk to, regardless of their ideology, doesn’t believe the county adequately listens to them. That message, distilled of ideological connotation, will travel far and wide.
Along with Rep. Jamie Raskin’s (D-8) support, this is the biggest endorsement to date received by the Madaleno campaign.
Choice, access to contraception and women’s health care are big issues, especially in this #metoo election. Additionally, U.S. House Republicans made reducing access to women’s health care services integral to their failed plan to gut the Affordable Care Act. So these issues are more salient than four years ago and MD NARAL’s imprimatur, always nice to have, is more valuable than usual.
Why did NARAL Pro-Choice Maryland endorse Rich Madaleno over his Democratic competitors?
For a start, though women form close to 60% of Democratic primary voters and are a critical constituency for any candidate, County Executives Kevin Kamenetz (D-Baltimore County) and Rushern Baker (D-Prince George’s) surprisingly did not submit questionnaires to MD NARAL.
Four other candidates – Ben Jealous, Alec Ross, Jim Shea, and Krish Vignarajah – were rated 100% by MD NARAL on their questionnaire responses. They will understandably tout this rating as good evidence of their staunch pro-choice and pro-women credentials.
Apparently, MD NARAL chose Madaleno over these four candidates based on his established record of not just supporting MD NARAL’s viewpoint on these questions but having delivered concrete legislative gains on a wide range of issues. As the Madaleno campaign explains in its press release:
Madaleno was the Democrat who protected funding for Planned Parenthood when it was attacked by Republicans in Congress in 2017. He has also co-sponsored a number of laws: to make feminine products available to homeless girls and women; to expand services to victims of sexual assault; and to ensure insurance coverage in Maryland for prescription contraceptive drugs and devices.

 Today, I look at forecasts for MetroRail and MetroBus for the two most recent comparable periods with available data. In the period from July 2017 through March 2018, MetroRail forecasts were above projections in four months and below in five months.
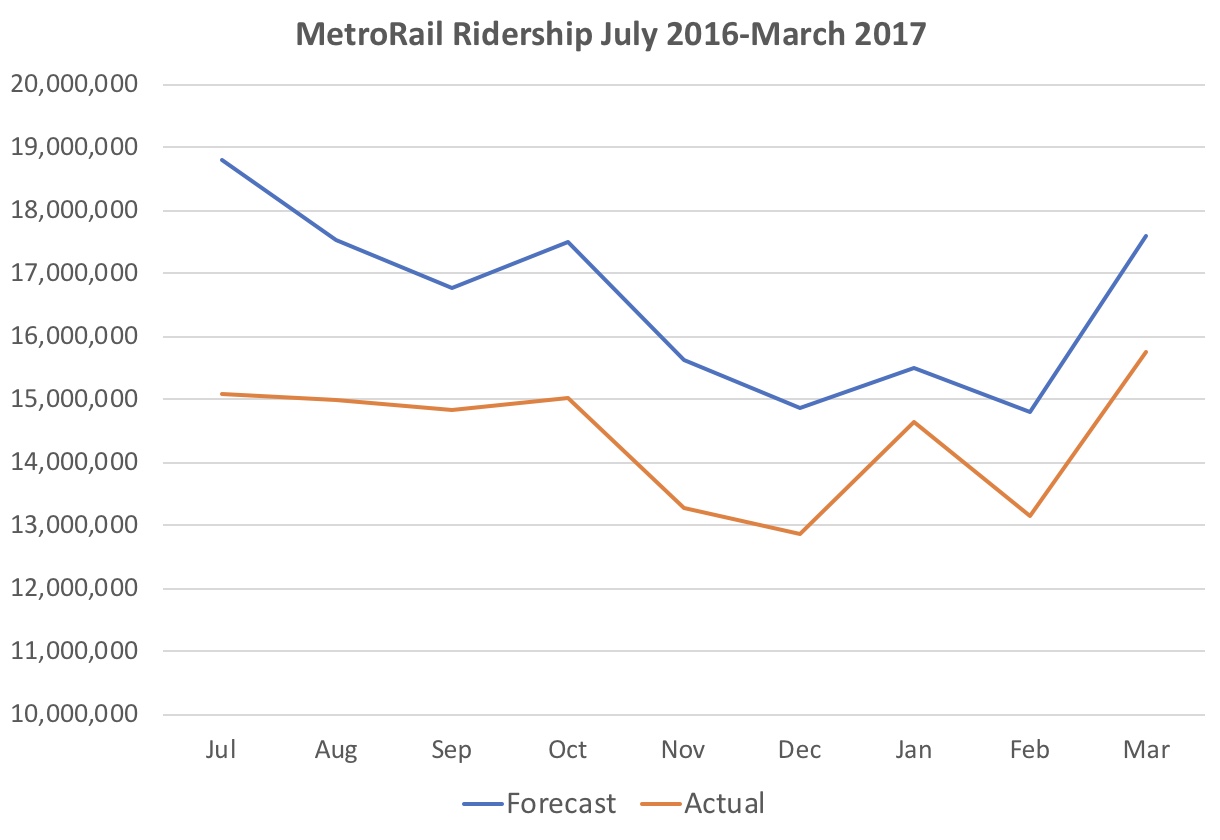 In July 2016 through March 2017, WMATA overestimated rail ridership every single month, resulting in a net overestimate of 19.4 million or 13.0%. However, though WMATA projections are less wildly optimistic, notice that the skew direction remains the same.
 WMATA projected more MetroBus riders every month than expected with the projections worse in the most recent months. Overall, there were nearly 4.5 million, or 5.1%, fewer riders than anticipated by the budget forecasts.
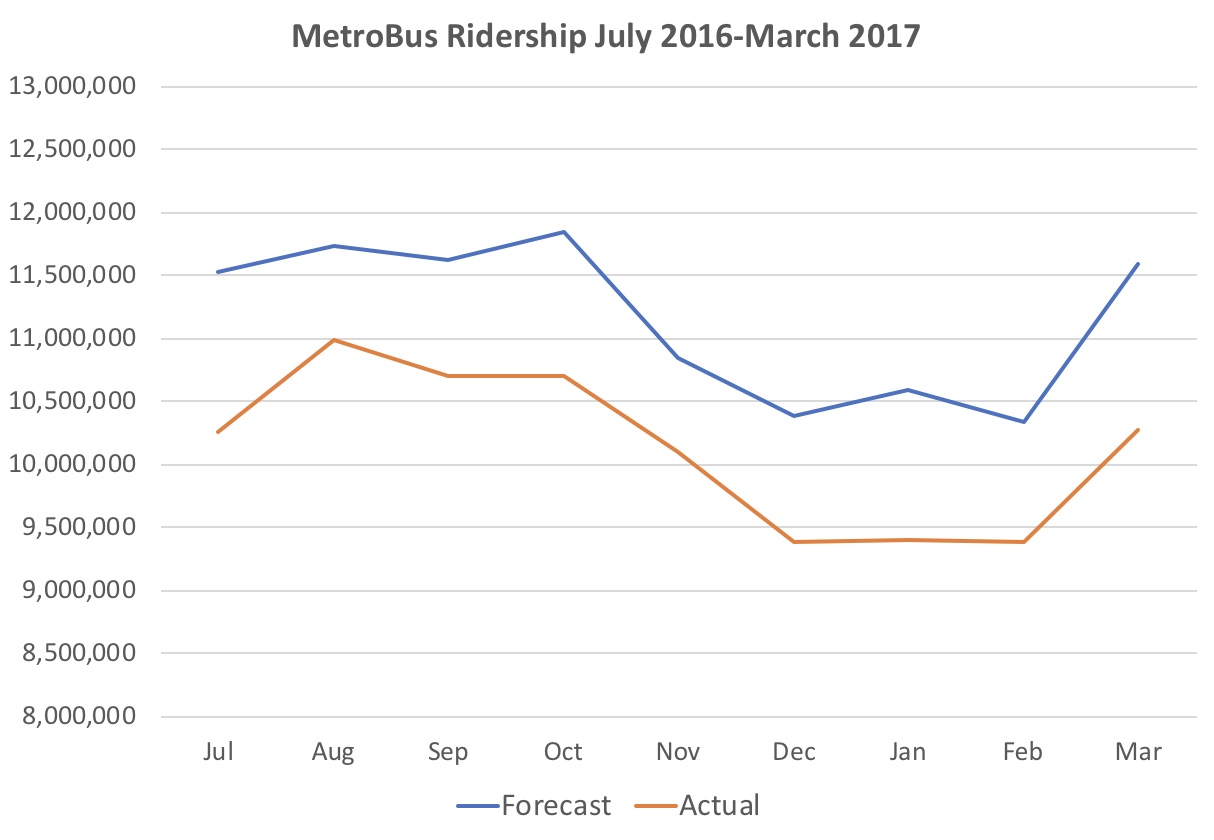 The previous year’s projections were off by even more in every single month. WMATA overestimated MetroBus ridership by 9.3 million. Actual ridership was 9.2% lower than the forecast.