All posts by Adam Pagnucco

MoCo’s Giant Tax Hike, Part Two

By Adam Pagnucco.

The County Council is calling its recently passed budget an “Education First” budget since it included an increase above the state-required minimum level for Montgomery County Public Schools.  Let’s evaluate that claim.

The council and the school system have had strained relations for a decade.  The problems began under former Superintendent Jerry Weast, who antagonized several Council Members with his hard-charging, overdriven style.  Nevertheless, Weast won several major budget increases for MCPS during his tenure.  Then came the Great Recession, which forced the county to make substantial spending cuts across all of its agencies.  One obstacle to cuts at MCPS was the state’s Maintenance of Effort (MOE) law, which sets a local jurisdiction’s per-pupil contribution to public schools as a base which cannot be lowered in future years unless a waiver is obtained from the state’s Board of Education.  In Fiscal Years 2010, 2011 and 2012, the county cuts its per-pupil contribution to MCPS, and in 2012, it did so without applying for a waiver.  As a result, the General Assembly changed the MOE law to force counties to apply for waivers or else have their income tax revenues sent directly to school systems.  At the same time, the General Assembly shifted a portion of teacher pension funding responsibilities, once solely the province of the state, down to the counties.  The combination of these two changes provoked outrage from county officials, some of whom vowed to never support a dime over MOE for MCPS in the future.

The chart below, which shows the recent history of Montgomery County’s local per-pupil contribution to the schools, illustrates the effects of these events.  After rising through FY09, the per-pupil contribution fell for three straight years and then was frozen for four straight years.  This year, the Executive proposed and the council approved an increased per-pupil contribution.  (Roughly $300 of the increase is accounted for by the county’s payment of teacher pensions.)  This is why the County Council is calling its budget an “Education First” budget.
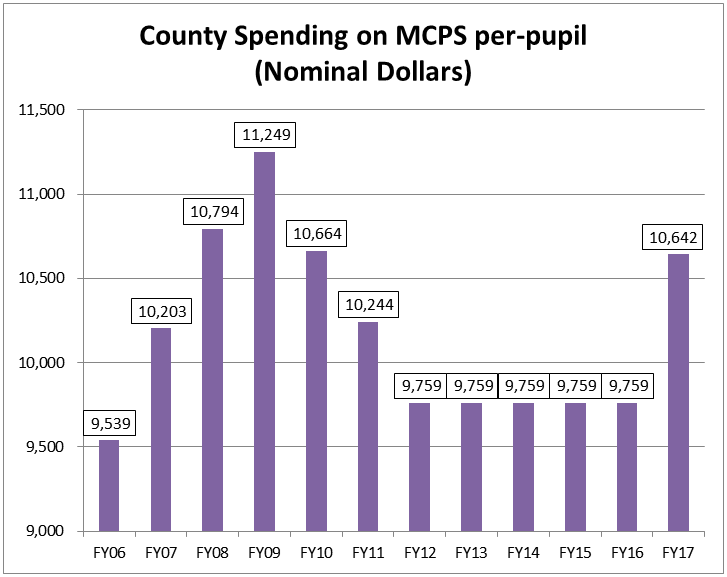
County Per-Pupil Spending on MCPS Nominal

But three items of context apply here.

First, the above chart does not include the effects of inflation, which erode dollar contributions over time.  The chart below shows per-pupil contributions in real dollars using 2017 as a base.  (Inflation in 2016 and 2017 is assumed to be 2.1%, the average of 2007-2015.)  Adjusted for inflation, the county’s current per-pupil funding is nowhere close to what it was before the Great Recession struck.
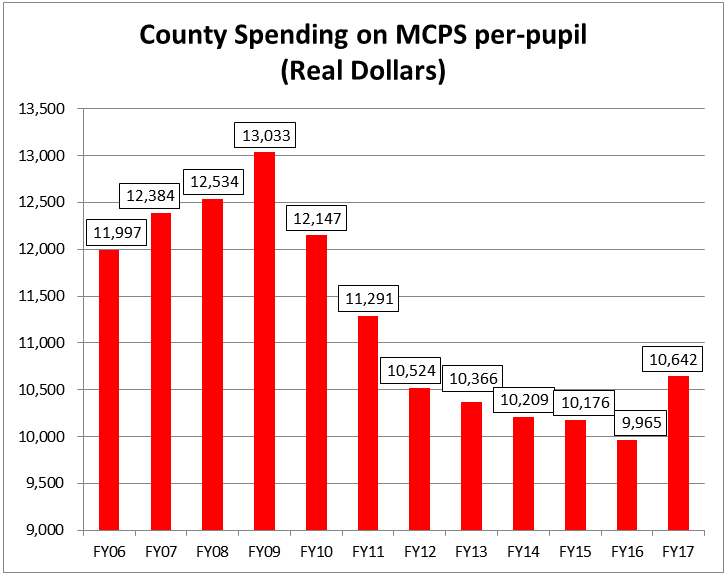
County Per-Pupil Spending on MCPS Real

Second, while MCPS was living under austerity, other county departments were receiving sizeable funding increases.  The chart below compares funding increases across several county departments and agencies including MCPS between FY10 (the pre-recession peak year) and FY16.  In terms of county dollars only, MCPS’s budget was cut from $1.57 billion to $1.54 billion over this period, a 2% cut, while many other departments enjoyed double-digit increases.  Can one good year make up for seven years of austerity for the public schools?
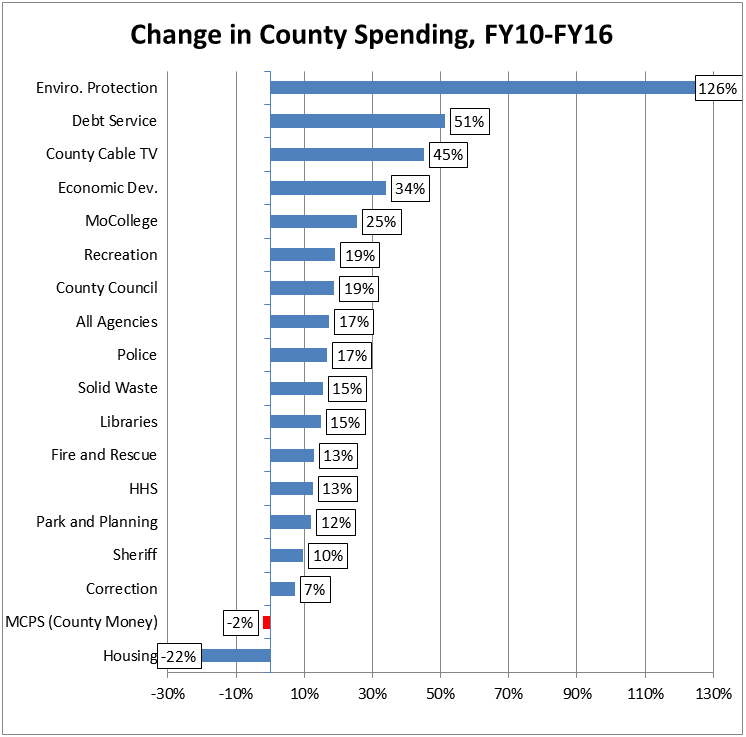
Change in County Spending FY10-FY16

Third, while county officials criticize the General Assembly for tightening the MOE law and shifting teacher pensions, it is the state that has been pumping substantial funding increases into MCPS’s operating budget.  The chart below shows that while county funding for MCPS was cut by $33 million between FY10 and FY16, state aid to MCPS rose by $192 million.

MCPS Local Money vs State Aid

The bottom line is that the new FY17 budget does add $110 million in local money to MCPS, an amount which exceeds the state-required maintenance of effort by $89 million.  But this one funding increase comes after seven years of reduced and frozen per-pupil contributions, a period during which the rest of the government enjoyed double-digit increases.  Council President Nancy Floreen has described the budget as “a historic partnership with the Board of Education” and “a plan for the future.”  Does that mean that the council will continue to exceed maintenance of effort and give the school system increases that match the rest of the government in future years?  Or will this be a one-year respite, after which austerity will return?

We will have more in Part Three.

Share

MoCo’s Giant Tax Hike, Part One

By Adam Pagnucco.

As part of the Fiscal Year 2017 budget, the Montgomery County Council has voted to increase property taxes by 8.7 percent.  This is a landmark event that is drawing attention from a large number of people who hold differing views.  While it is a dramatic development, it is also the product of several factors that have been building for a number of years.  This series will explore those factors, explain how it happened, and look at the future.

First, a bit of background.  Property taxes are the number one source of revenue for Montgomery County Government, as they are for most, if not all, county governments in Maryland and Virginia.  In recent years, property taxes have accounted for 35-40% of the county’s total revenues, and the average household paid $4,154 in FY16.

In 1978, the nationwide property tax revolt that produced Proposition 13 in California came to Maryland.  That year, Prince George’s County voters passed the Tax Reform Initiative by Marylanders (TRIM) charter amendment, which placed a hard cap on property tax collections, and replaced it with a rate cap in 1984.  A 1996 referendum to repeal the cap failed.  Montgomery County voters also saw a TRIM charter amendment in 1978, but they voted it down by a 52-48% margin.  In 1990, Montgomery civic activist Bob Denny authored a charter amendment limiting growth in property tax collections to the rate of inflation, and county voters passed it.  But the charter amendment contained an override provision allowing the County Council to exceed the limit on a 7-2 vote.

By the 2000s, the charter limit’s constraint on the council began to evaporate.  The council voted to exceed the limit in FY03, FY04, FY05 and FY09, thereby prompting Robin Ficker to place one of his many anti-tax charter amendments on the ballot in 2008.  After years of failure, the same general electorate that voted for Barack Obama for President by 45 points approved Ficker’s amendment by 5,060 votes.  Ficker’s amendment did not convert the property tax limit to a hard cap, but it did require all nine Council Members to vote in favor of exceeding it.  The council has not done that until this year’s budget.

It’s worth understanding how Montgomery County’s charter limit works.  Section 305 of the charter states the following.

Unless approved by an affirmative vote of nine, not seven, Councilmembers, the Council shall not levy an ad valorem tax on real property to finance the budgets that will produce total revenue that exceeds the total revenue produced by the tax on real property in the preceding fiscal year plus a percentage of the previous year’s real property tax revenues that equals any increase in the Consumer Price Index as computed under this section. This limit does not apply to revenue from: (1) newly constructed property, (2) newly rezoned property, (3) property that, because of a change in state law, is assessed differently than it was assessed in the previous tax year, (4) property that has undergone a change in use, and (5) any development district tax used to fund capital improvement projects.

This is not a cap on rates.  It is a cap on collections, which are not allowed to grow faster than the rate of inflation with certain exceptions unless all nine Council Members vote to override.  Collections are a product of both rates and assessments.  If assessments grow rapidly, it’s possible for the county to cut the tax rate and still grow collections to the limit (or beyond).  Conversely, if assessments fall, the rate could rise and collections might grow slowly (or even shrink).  This distinction is key to understanding how the county makes decisions on this item.

In the new FY17 budget, County Executive Ike Leggett proposed increasing the property tax rate by 3.94 cents per $100 of assessed real property, an increase of 8.7 percent that would have raised $140 million more than the charter limit.  The Executive cited two main reasons for doing so: the challenge of dealing with the adverse consequences of the U.S. Supreme Court’s Wynne decision, which required large refunds to be paid to some county taxpayers, and the fiscal needs of the public schools.  We will look at both of those items as this series continues.

Share

CD8 Primary Election Results, Part Four

A guest blog by Adam Pagnucco.

Let’s put together the previous three parts and look in detail at the strengths and weaknesses of the top three candidates.

Senator Jamie Raskin

Strongest Performances

Takoma Park: 64.2% (1st)

Legislative District 20: 51.9% (1st)

Silver Spring Inside the Beltway: 49.9% (1st)

Inside the Beltway: 47.9% (1st)

Montgomery County Council District 5: 47.2% (1st)

Chevy Chase: 45.5% (1st)

Cabin John: 41.6% (1st)

Bethesda: 41.3% (1st)

Montgomery County Council District 1: 41.3% (1st)

Legislative District 16: 40.6% (1st)

Weakest Performances

Derwood: 11.0% (3rd)

Carroll County Total Votes: 12.0% (3rd)

Damascus: 12.5% (3rd)

Frederick County Total Votes: 12.7% (3rd)

White Population Over 90%: 13.6% (3rd)

Glenmont/Norbeck: 15.0% (4th)

The above areas illustrating Raskin’s greatest strengths have something in common: they are all totally or primarily inside the Beltway.  (Most of the portion of Council District 1 that is outside the Beltway is in Congressional District 6.)  The areas showing his greatest weaknesses also have something in common: they are all totally or primarily outside the Beltway, some of them a considerable distance outside.  Raskin expanded his geographic base successfully since 74% of his votes came from outside District 20, but his votes began to dry out north of Norbeck Road.  His 6.5 point victory was due to his ability to consolidate the vote in Downcounty precincts while pulling just enough votes from the north to prevent David Trone or Kathleen Matthews from winning.

David Trone

Strongest Performances

Carroll County Total Votes: 51.8% (1st)

White Population Over 90%: 51.4% (1st)

Frederick County Total Votes: 51.2% (1st)

Damascus: 44.9% (1st)

Montgomery County Council District 2: 41.5% (1st)

Legislative District 15: 38.6% (1st)

Derwood: 36.9% (2nd)

Glenmont/Norbeck: 36.1% (1st)

Potomac: 35.1% (1st)

Legislative District 14: 34.2% (1st)

Weakest Performances

Takoma Park: 11.7% (3rd)

Chevy Chase: 13.9% (3rd)

Inside the Beltway: 15.8% (3rd)

Legislative District 20: 16.8% (3rd)

Silver Spring Inside the Beltway: 17.0% (3rd)

Bethesda: 18.1% (3rd)

Montgomery County Council District 1: 18.4% (3rd)

Montgomery County Council District 5: 18.5% (2nd)

Legislative District 16: 19.3% (3rd)

Cabin John: 19.7% (3rd)

Trone’s strengths and weaknesses are the mirror image of Raskin’s.  He lost to both Raskin and Matthews inside the Beltway, but as the precincts went farther north, Trone got stronger.  Trone’s success in the northern Counties as well as Upcounty Montgomery will no doubt cause him to take a hard look at the Congressional District 6 seat should John Delaney run for Governor.  Western Maryland accounts for a fifth of CD8’s Democratic primary voters, but in CD6, it accounted for roughly 40% of the vote in both the 2016 and 2014 Democratic primaries.  One interesting thing not shown here: Trone was the leader in majority-minority, heavily Hispanic and heavily Asian precincts.

Kathleen Matthews

Strongest Performances

Derwood: 40.8% (1st)

Leisure World: 33.1% (1st)

Bethesda: 32.5% (2nd)

Legislative District 16: 32.3% (2nd)

Cabin John: 32.0% (2nd)

Chevy Chase: 32.0% (2nd)

Montgomery County Council District 1: 31.6% (2nd)

Weakest Performances

Takoma Park: 8.4% (3rd)

Silver Spring Inside the Beltway: 13.4% (3rd)

Blacks Over 33% of Population: 15.2% (3rd)

Montgomery County Council District 5: 15.2% (3rd)

Hispanics Over 33% of Population: 16.0% (4th)

Whites Under 40% of Population: 16.6% (3rd)

Majority-Minority Precincts: 17.7% (3rd)

Matthews finished second in most parts of CD8, which isn’t bad, but she finished first in just two local areas: Leisure World and Derwood, which has only one precinct in the district.  If she had also finished first in, say, Bethesda and Chevy Chase, she might have gotten close, but Raskin owned the areas inside the Beltway.  Matthews told the Washington Post that she was thinking of running for local office in the future. Here’s an idea for her: in a County Council at-large race, the top four vote-getters triumph.  A candidate who finishes second everywhere would be a lock to win.

Now here’s an interesting thought.  With Raskin going to Congress, Matthews thinking about running again and Trone not ruling it out either, could all three of them ultimately be in office after the next election?

Share

CD8 Primary Election Results, Part Three

A guest blog by Adam Pagnucco.

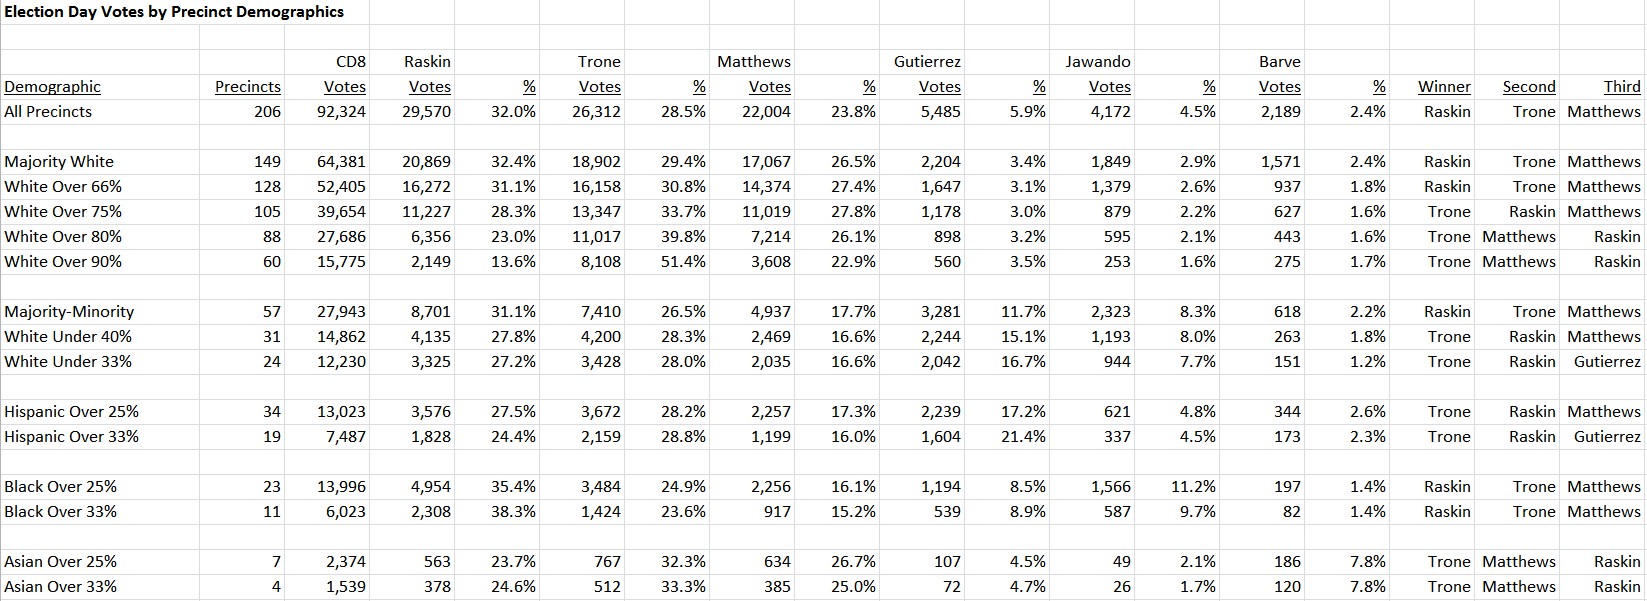
The data below combines precinct information with census tract data on Hispanic origin and race from the 2010 Decennial Census.  The demographics of the three counties are very different.  Of the 67 precincts in Carroll and Frederick Counties, 63 had populations that were at least 90% white.  Of the 139 precincts in Montgomery County, 57 were majority-minority.  These differences influence the presentation below.

Here are the results for precincts by their population percentages in different demographic categories.

CD8 Votes by Demographics 2

At first glance, the data shows a seeming contradiction.  Trone led in precincts with populations over 75% white.  But Trone also led in precincts with less than 40% white populations.  How can this be?  The former fact is explained by Trone’s victory in the overwhelmingly white precincts of Carroll and Frederick.  The latter fact is explained by Trone’s wins in Gaithersburg, Glenmont/Norbeck and parts of Rockville, which are racially diverse.  Trone also finished a close second in Wheaton and Silver Spring East County.  While Senator Jamie Raskin won big in diverse precincts in Takoma Park and Silver Spring Inside the Beltway, he also won in predominantly white Bethesda, Cabin John, Chevy Chase and Kensington.  Delegate Ana Sol Gutierrez was a factor in Glenmont/Norbeck (Zip Code 20906 excluding Leisure World), finishing second in the nine precincts there.  She finished third in the 19 precincts with at least 33% Hispanic populations.

We will have a summary of the candidates’ performance in Part Four.

Share

CD8 Primary Election Results, Part Two

A guest blog by Adam Pagnucco.

It’s time to dig deeper on geography.  Below are election day results for every state legislative district overlapping with Congressional District 8.

CD8 Votes by State Legislative District 2

Of the twelve legislative districts sharing precincts with CD8, David Trone won nine of them.  Predictably, he won the five legislative districts in Carroll and Frederick Counties, and he got majorities in three of them.  He also won the precincts in Districts 14, 15, 17 and 19.  Senator Jamie Raskin won the precincts in Districts 16, 18 and 20, but those three accounted for 58% of election day votes.  No other candidates won any legislative districts.

A note about District 20, Raskin’s home base.  He received 52% of its votes, which was a lower percentage than Trone received in three northern legislative districts.  Seventy-four percent of Raskin’s election day votes came from outside District 20, meaning that he succeeded in diversifying his geographic base – primarily to other precincts inside the Beltway.  Raskin received more votes from District 16 than from District 20.

Here are the same results for county districts.

CD8 Votes by County Districts 2

Again, Trone won every county district in Carroll and Frederick.  But he also won the precincts in Montgomery County Council Districts 2, 3 and 4.  Raskin won the precincts in Montgomery County Council Districts 1 and 5, and those two districts accounted for 54% of election day votes.

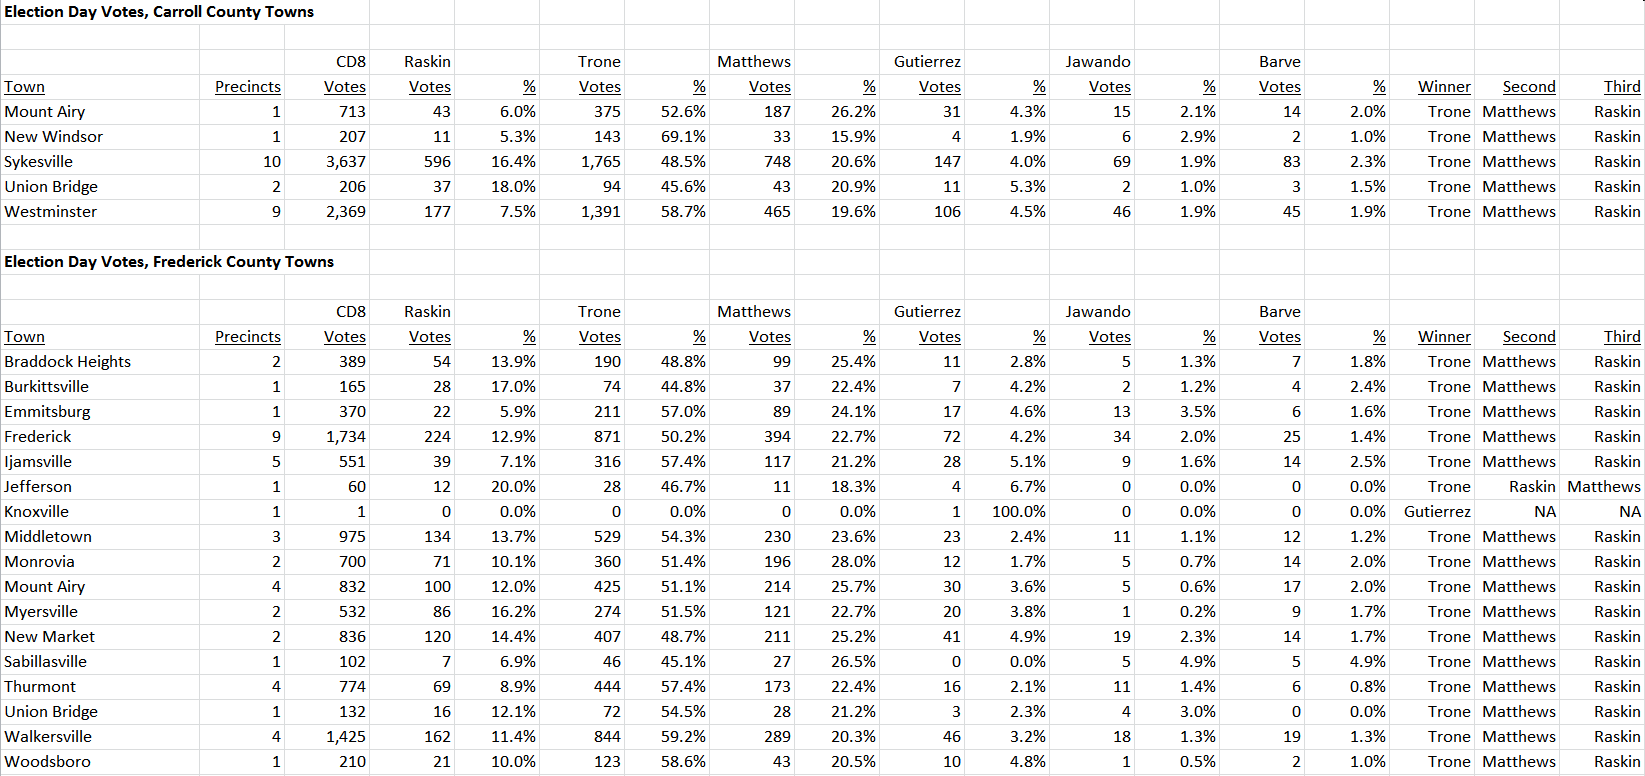
Here are the results for towns in Carroll and Frederick Counties.

CD8 Votes by Towns Carroll Frederick 2

Trone got a clean sweep here with one exception: in one precinct in Knoxville (Frederick County), one vote was cast and it went to Delegate Ana Sol Gutierrez.  In every other case, the rank order was Trone first, Matthews second and Raskin third.

Now here are the results for towns in Montgomery County.  Wheaton is defined as Zip Code 20902.  Glenmont/Norbeck is defined as Zip Code 20906 except for Leisure World, which is separated out.  Silver Spring (East County) is defined as Silver Spring precincts not in Zip Codes 20902 or 20906 and located outside the Beltway.

CD8 Votes by Towns Montgomery 2

These results are much more diverse.  Of the fifteen towns in Montgomery, Raskin won eight: Bethesda, Cabin John, Chevy Chase, Kensington, Silver Spring (East County), Silver Spring (Inside the Beltway), Takoma Park and Wheaton.  No other candidate won a town inside the Beltway.  Kathleen Matthews won Leisure World and Derwood, which had just one precinct.  Trone won Damascus, Gaithersburg, Glenmont/Norbeck, Potomac and Rockville.  Delegate Ana Sol Gutierrez finished second in Glenmont/Norbeck, an area with a substantial Latino population.  The local data in Montgomery supports the narrative that Raskin’s victory was supported primarily by Inside the Beltway voters, and he rounded up enough votes from other places to prevent either Trone or Matthews from breaking through.

We will look at precinct demographics in Part Three.

Share

CD8 Primary Election Results, Part One

  A guest blog by Adam Pagnucco.

It has been roughly three weeks since Maryland’s primary election on April 26 and most of the results are in.  All jurisdictions have reported returns from early voting, election day, absentee ballots and provisional ballots and unofficial precinct-level data files have been released.  While the City of Baltimore’s results have some problems, they are not relevant to Congressional District 8.  The time for a data crunch has arrived.

First, let’s examine the overall results.

CD8 Overall Results 2

Senator Jamie Raskin was the leader in early votes, election day votes and absentee and provisional ballots, but his leads were of different magnitudes.  Raskin won early votes by 16.1 points, a far larger margin than his wins in absentee and provisional votes (7 points), total votes (6.5 points) and election day votes (3.5 points).  As we proceed to analyze precinct votes on election day, let’s recognize that they underrate Raskin’s strength relative to the total vote count.

Here are total votes and election day votes by county for the top six candidates.

CD8 Votes by County 2

David Trone won an absolute majority of both total votes and election day votes in Carroll and Frederick Counties, but they comprised about a fifth of the electorate.  Raskin won Montgomery County by 13.7% in total votes and 12.3% on election day.  Kathleen Matthews placed second in all three counties.

This partially obscures the story of geography at a macro level.  Consider the following three areas: precincts inside the Beltway, precincts outside the Beltway and still in Montgomery, and Carroll and Frederick together.

CD8 Votes by Geography 2

Raskin won the Inside the Beltway precincts by 23.7% over Matthews, and since these are just election day votes, that probably understates his margin.  But in the Outside the Beltway Montgomery precincts, Raskin and Trone were basically tied while Trone won the northern counties handily.  Interestingly, more Montgomery County votes came from outside the Beltway than inside, but because Raskin had such huge support from inside precincts, he was able to withstand his opponents’ performance in other areas.

We will have a finer cut on geography in Part Two.

Share

CD8: The Aftermath

A guest blog by Adam Pagnucco.

For the sake of posterity, here are a few thoughts on The Aftermath of the historic race for Congress in District 8.

Jamie Raskin

Senator (soon-to-be Congressman) Raskin is now the King of MoCo Progressives, a title he would have gained even if he had lost the election.  Raskin is the King because of the kind of campaign he ran, which mixed liberal issues with a record of accomplishment, a dose of passion and a lot of inspiration.  The fact that he had two well-financed opponents, one of whom was self-funded, played into his narrative.  For progressives, he appealed to both their hearts and their brains.  His vote percentage, currently about a third of the electorate, came from high-information voters, super-liberals and Downcounty residents, a desirable base for almost any MoCo candidate.  It would not be a stretch to imagine that he had the support of 90% or more of the party activists who often play outsized parts in deciding County Council and state legislative races.

All of this gives Raskin enormous potential influence over county politics.  Chris Van Hollen was the most popular elected official in MoCo during his tenure in the U.S. House, but he was rather cautious about using that asset.  He endorsed sparingly in primaries, and even then with great care.  Examples include safe picks like County Executive Ike Leggett in 2014 and the incumbent state legislators in District 18, where he served as a State Senator and Delegate.  Van Hollen never took chances on endorsing unknown or controversial candidates.  Raskin will soon be approached by many politicians, incumbents and non-office holders alike, seeking his support.  Will Raskin follow the Van Hollen model and stay out of most races?  Or will he actively try to get very progressive candidates elected down the ballot?  Lots of politicians and activists would like to know the answer to this question!

David Trone

Ninety days ago, few voters had any idea who David Trone was.  Many millions of dollars later, Trone finished six points behind Raskin, a margin that could tighten a little bit as absentee ballots are counted.  As David Lublin has noted, Trone ran a competent, professional campaign that put batters on all the bases – advertising, mail and field.  He bested Kathleen Matthews, who had been running for many months, and smoked the rest of the field.

Trone should be encouraged by his showing in Carroll and Frederick Counties, where he finished with 53% and 52% of the vote, respectively (and that is before absentee counts come in).  If Congressman John Delaney runs for Governor, Trone’s performance in the two Western Maryland counties suggests that he has potential in Congressional District 6.  If Trone would like to run for office again – and he is considering it – one weakness that he should consider addressing is the allegation that he has not been involved in local affairs.  Trone would be a great champion for the local business community, and he could also be a patron for Democratic Party activities and institutions.  Projects like these would shore up his hometown credibility and set him up well for Round Two, whatever that might be.

Kathleen Matthews

Along with U.S. Senate candidate Donna Edwards, Matthews was the biggest disappointment of the night.  She ran a well-funded, female-oriented campaign against two leading opponents who were men.  She had great fundraising and solid TV ads.  The electorate is sixty percent female.  Hillary Clinton won the presidential primary in Maryland by thirty points.  And yet Matthews finished third with 24% of the vote.  How does that happen?  One theory is that Trone won over many of the more moderate voters who might have found Matthews appealing, and there is something to that.  Another theory is that Matthews’s campaign, along with that of Donna Edwards, illustrates the limitations of pure identity politics.  And finally, her generic campaign had little local dimension to it and did not create sufficient distinction from her opponents.

Ana Sol Gutierrez

Trailing badly in fundraising, mail and television, Delegate Ana Sol Gutierrez still finished fourth.  When the precinct results come in, she will probably have significant vote totals in Wheaton, Long Branch, Glenmont and areas near University Boulevard, all places with significant Latino populations.  This will firmly entrench her as the Queen Mother of MoCo Latinos and also shows the latent political potential of that community.  That’s not a bad consolation prize.

Will Jawando

When is it a candidate’s time, and when is that time past?  That is the key question with Will Jawando.  His talent, charisma, intelligence and presentation skills are undeniable.  He’s a very good fundraiser and came close to winning a District 20 Delegate seat two years ago.  And MoCo needs more young leaders of color.  But Jawando was never going to win this race and now he has two losses on his record.  Yes, candidates can come back from that – Marc Elrich, for example, lost four times before being elected to the County Council.  But Elrich is an exception and repeated losses tend to reduce both support and fundraising capability for most candidates.  Our hunch is that Jawando has one more good election in him that he would very much need to win.

Another factor is the upcoming District 20 appointment process.  The Montgomery County Democratic Central Committee will appoint a successor to Jamie Raskin’s Senate seat when he vacates it.  The appointee will most likely be one of the two freshman Delegates, David Moon or Will Smith.  That will then open a Delegate seat vacancy.  Jawando, who finished fourth in the House race in 2014, would have had a significant claim to that appointment.  But running unsuccessfully against the King of MoCo Progressives – a man who has been the undeniable King of District 20 for a decade – hurts his chances.  This was a missed opportunity all around.

Kumar Barve

If voters voted on resumes, Delegate Kumar Barve would have won.  He has been in office since 1990 and has adroitly climbed the Annapolis ladder to House Majority Leader and standing committee chair.  He has been involved in every major policy debate at the state level for many years.  And he’s whip-smart, well-spoken and funny as hell.  But Barve couldn’t get traction in the race as he was drowned out by the better-funded candidates.  Barve didn’t get what he wanted, but MoCo residents will get something valuable as he goes back to Annapolis: a dedicated, substantive leader on environmental and transportation issues.

That’s about it for now.  We will be following up with data on this election as it becomes available.  In any event, one thing is sure: this race will be remembered around here for a long, LONG time.

Share

Absentee Ballots Spike in CD8

A guest blog by Adam Pagnucco.

Jonathan Shurberg kindly passed along a tip that absentee ballots are waaay up in CD8.  He’s right, and that could have an impact on our congressional primary.

The state’s Board of Elections has released absentee ballot statistics by congressional district and party.  CD8 has about one-eighth of the state’s population.  But among Democrats, it has accounted for 27% of absentee ballots sent to voters and 25% of absentee ballots received by the state.

Absentees by CD

The Board of Elections also reports absentee ballots by state legislative district.  Among Democrats, the five legislative districts from which the state received the most absentee ballots are all partially or entirely inside CD8.  Legislative District 16, home to high turnout precincts in Bethesda and Chevy Chase, is the runaway leader.  Legislative District 20, home base to Senator Jamie Raskin, ranked fifth.

Absentees by LD

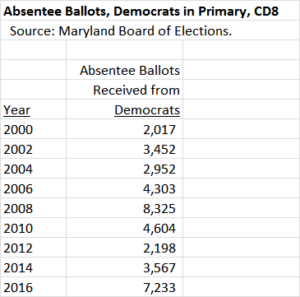
Below are absentee ballots cast by Democrats in CD8 primaries from 2000 through 2016.  The lead year for absentee voting was 2008, a record-breaking primary across the state which saw a contested election for President.  This year’s primary is set to be at least number two on this measure.  A caveat applies: CD8’s boundaries were significantly changed in 2012, as it lost many high turnout precincts in Potomac and gained many less-Democratic precincts in Frederick and Carroll Counties.  Accounting for that fact, the absentee returns in 2008 and 2016 are in the same ballpark.  Another thing: mailed absentee ballots with postmarks on or before election day will be accepted by the state through May 6, so more ballots will be received.

Absentees CD8 Dems Historic

The competitive presidential primary between Hillary Clinton and Bernie Sanders is definitely responsible for part of this spike.  Competitive presidential elections draw out voters like no other down-ballot offices do.

But we also hear that David Trone’s campaign has been running an aggressive absentee ballot program.  This is part of Trone’s strategy to expand the electorate beyond regular Democratic voters.  By mailing to registered Democrats who do not get mail from other candidates, saturating televisions, laptops, tablets and smartphones with ads and even advertising on Baltimore TV stations, Trone is betting that he can turn out voters who hear primarily or only from him.  That’s his strategy for victory, and the absentee ballot performance may be a sign of it.

If Trone is deadlocked for the lead with another candidate at the end of tonight, don’t be surprised if the absentee ballots give him a win.

Share

Updated: Broadcast TV Spending in CD8

The following is a guest post by Adam Pagnucco.

We are now at the end of a record-breaking, historic and extremely expensive Democratic primary for Congress in District 8.  The leading category of spending in the race is television advertising.  Broadcast TV contracts for political ads are available on the Federal Communications Commission’s website, but they are not readily searchable or crunchable.  We tracked and broke down candidate spending on 127 contracts through noon, April 4 three weeks ago.  The updated data below pertains to 218 contracts uploaded as of Saturday afternoon, April 23, and should cover almost all broadcast TV spending in the primary.

First, let’s look at the number of spots and gross spending for each broadcaster.  This data does not include production costs for the ads, only payments to broadcasters to run them.

Broadcast TV Spending by Network

WRC-TV, the Washington NBC affiliate, has been the leading network here for years and accounts for roughly a third of spots and more than 40% of gross spending.  Its news programs, including the Today Show, the local news shows and NBC Nightly News, are among the most desirable – and most expensive – programs for political advertisers.  Three Baltimore broadcasters appear in our dataset because Total Wine co-owner David Trone is advertising on them to reach Carroll County voters.

Television spending has increased steadily since January 26, when Trone kicked off the CD8 2016 ad season.  Former WJLA anchor Kathleen Matthews began advertising on February 8.  Senator Jamie Raskin joined in on March 24 and Delegate Kumar Barve followed on April 6.  April has been a lucrative month for Washington broadcasters, especially WRC.

Broadcast TV Spending by Month

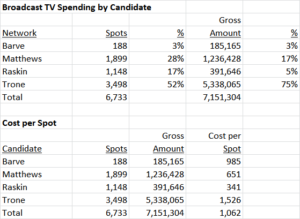
David Trone is the king of TV spending, accounting for the majority of spots and 75% of gross payments.  Trone heavily targets national and local news programs for his ads, considered by many to be solid places to reach voters.  Barve prefers these programs too.  Matthews keeps her costs down by mixing in cheaper daytime television like The Meredith Viera Show, Days of Our Lives, Who Wants to be a Millionaire, CBS Soaps and The Insider.  Raskin runs 15-second spots, half the length of his competitors, and that’s why he has the lowest cost per spot.

Candidate and Cost per Spot

Trone has been on TV the longest and has spent the most money by far, but the entrance of other candidates has cut into his dominance a bit.  Still, even in April when all spigots were opened, Trone had a 68% market share.  Trone spent almost as much on April broadcast TV as Matthews has spent on all items in her entire campaign, and more than Raskin has spent in total.

Candidate and Month

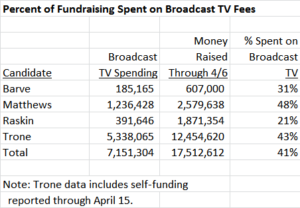
Despite his unprecedented TV spending, Trone’s campaign is not the most TV-intensive as a proportion of total funds.  That distinction belongs to Matthews.  Her broadcast TV spending accounts for 48% of the money she raised through April 6.  Trone’s TV spending accounts for 43% of his resources (including two late contributions through April 15).  Barve and Raskin trail on this measure.  Matthews is able to put more of her money into TV, an area in which she excels, because Emily’s List has basically taken over her mail program.  This is a significant advantage for Matthews.  Aside from the authority line, voters likely cannot distinguish between Emily’s List mailers and anything they have seen from the Matthews campaign.

Percent Spent on Broadcast TV

If spending alone determines the outcome of the race, Trone is going to win.  However, about sixty percent of the electorate is female and that will help Matthews.  And Raskin’s grass-roots support has been second to none.  We are headed towards an exciting finish!

Share

How David Trone Could Win

A guest blog by Adam Pagnucco.

Congressional District 8 has three strong Democratic candidates with a chance to win.  One of them is Total Wine co-founder David Trone.

Strengths

Let’s start with the obvious: Trone has accounted for two-thirds of all funding in the race and three-quarters of broadcast TV spending.  He leads the field in mail and digital ads too.  As David Lublin has written, his campaign has been well run and professional.  Trone’s rags-to-riches life story is compelling and will appeal to many.  He is running as the outsider candidate in a year in which outsiders have seen success at the presidential level in both parties.  He is running against PACs and lobbyists more than he is against his opponents.  (Only PACs and lobbyists could rival the current Congress in unpopularity!)  And Trone has been an active campaigner at the retail level, appearing at Metro stations and many events.

Weaknesses

Trone had a bad start, openly saying “I sign my checks to buy access” when questioned about why he contributed to Republicans and having to apologize when his campaign sent a spy to the Matthews and Raskin offices.  He is pilloried by Raskin loyalists and some of his opponents for his self-funding.  He is not a natural politician and has had to learn the ropes quickly.  He was unknown in the district in the beginning (boy, has that changed!) and has no local political history.  And he is not as good a fit for the district’s electorate as a liberal state senator or a telegenic, professional woman.  But Trone’s financing as well as the competent campaign operation he has built virtually overnight make him a big factor in this race.

What Our Sources Say

Source: “Trone is not a naturally attractive candidate, but he seems to be the rare self-funding first-timer who has allocated his resources wisely and widely across the spectrum of voter contact methods and has mostly avoided unforced errors, some early missteps notwithstanding. He has hired competent professionals to produce television ads and direct mail pieces of workmanlike quality while also using paid canvassers, online ads, etc. If he loses it will not be because he failed to touch all of the bases or because he failed to heed the advice of people who know how to run political campaigns.”

Source: “If there’s anything Montgomery County politics could use, it’s someone to shake things up. Our politics are boring and our politicians are all the same. I love the fact that Trone’s not part of the small insiders club, and rather than being shy about it, he’s proud of it. With the Republican Party shifting hard to the far right nationally, the Democratic Party should be seizing the hole left for the business community – and with his business background and progressive politics, David Trone is the kind of guy who can help make that happen.”

Source: “Running a terrific outsider gubernatorial campaign, but he’s running it for a House seat.  Good ads, good mail, and showing up everywhere he needs to, just not getting traction because the legislative job doesn’t match his executive credentials.”

Source: “David’s candidacy will test the political theory about whether the Delaney model for victory was a fluke or is a viable way to reach Congress in Maryland. In terms of policy, demeanor, desire and political acumen, he is the best choice. He has the potential to actually change Congress for the better. So, did his late entry hurt him? Do enough people know him? Is money the ultimate decider in our local Congressional races? He’s never held political office, does that matter? If he is elected, does that mean that most MoCo voters are actually more moderate and business friendly than we think they are? David’s candidacy is the most intriguing because it tests all of these questions. If he wins, the party establishment loses two congressional seats in a row – CD6 and CD8.”

How He Could Win

Because of his resource advantage, Trone doesn’t have to run a targeted race – he can communicate with everybody.  His television and digital ads go out to regular voters, casual voters, non-voters, members of other parties and non-residents alike.  His mail program can reach out to all registered Democrats.  Raskin’s base will never abandon him and many women will go for Matthews, but there are thousands of Democrats in the district who know only one candidate: David Trone.  If turnout is high and is not based just in the Downcounty areas that are the home of the district’s liberal, high-information voters, there will be lots of people who will vote for President, know nothing of Congress, and vote for U.S. House candidates based on little more than name recognition.  This is the antithesis of the scenario most favorable to Jamie Raskin – a large, casual, mixed-ideology electorate who come from Carroll, Frederick and Upcounty nearly as much as they do from the Beltway region.  If that happens and turnout approaches 2008 levels, David Trone could be going to Congress.

Share