Tag Archives: Taxpayer Flight Series

Taxpayer Flight from MoCo, Part Five

By Adam Pagnucco.

Today, we conclude looking at jurisdictions with whom MoCo has had inflows and outflows of tax returns and adjusted gross incomes.

Loudoun County

Net change in tax returns, 2006-2016: -1,507 (outflow)

Net change in adjusted gross income ($2016), 2006-2016: -$208 million (outflow)

Adjusted gross income of in-migrants ($2016), 2006-2016: $76,287

Adjusted gross income of out-migrants ($2016), 2006-2016: $100,587

Migrant income gap: Out-migrants earned 32% more than in-migrants

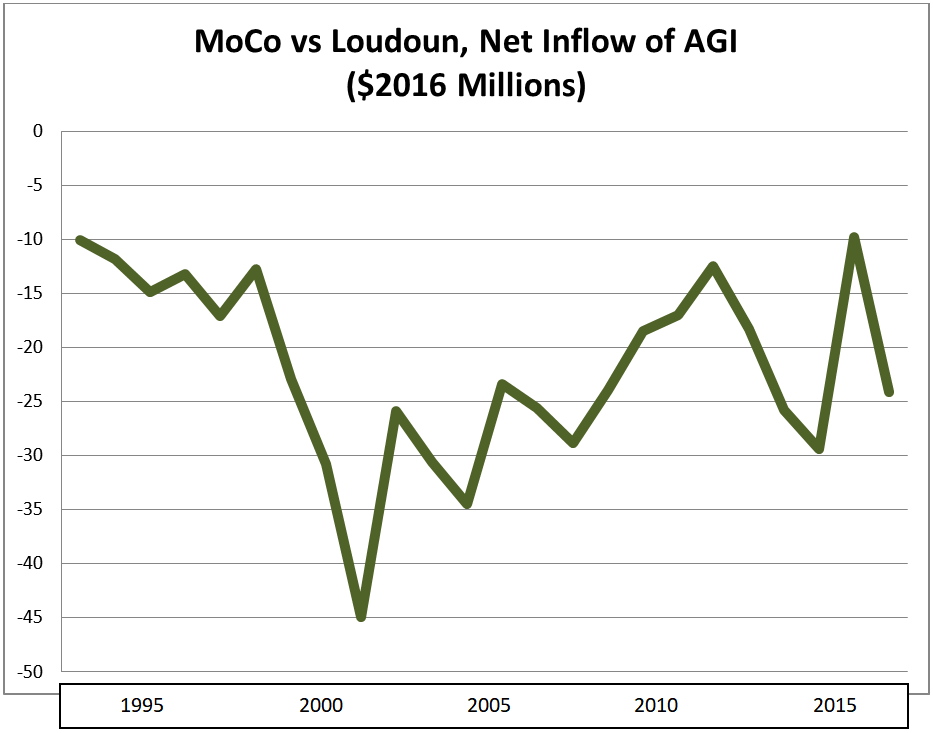
Loudoun has been the fastest-growing large jurisdiction in the Washington region for a long time and was once one of the fastest-growing places in the country.  Much of its growth has come from people relocating from Fairfax but it has gained some folks from MoCo too.  As the wealthiest county in the nation, it’s no surprise that its migrants from MoCo skew to high earners.

Howard County

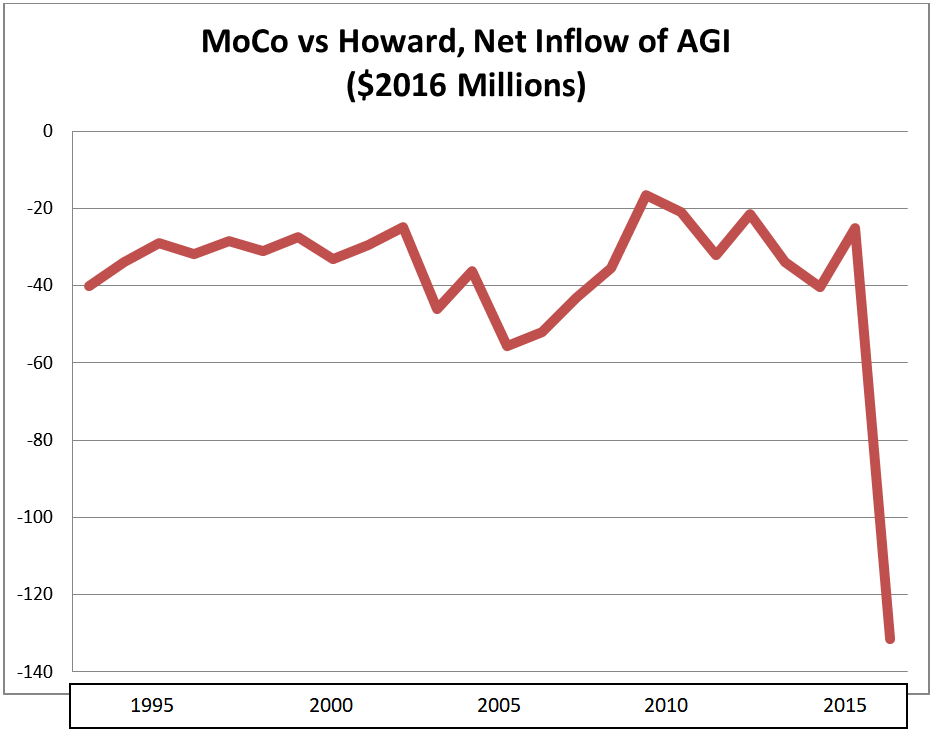
Net change in tax returns, 2006-2016: -2,859 (outflow)

Net change in adjusted gross income ($2016), 2006-2016: -$400 million (outflow)

Adjusted gross income of in-migrants ($2016), 2006-2016: $72,231

Adjusted gross income of out-migrants ($2016), 2006-2016: $90,724

Migrant income gap: Out-migrants earned 26% more than in-migrants

Howard is MoCo’s smaller and wealthier neighbor to the northeast.  It gains relatively small amounts from MoCo every year but set a record in 2016, when $131 million of taxpayer income left MoCo for Howard.  Howard’s schools and quality of life are comparable to MoCo but its significant distance from D.C. has limited its ability to compete for people who work downtown.  Ironically, the joint bus rapid transit route on US-29 that MoCo is working on with Howard could help remedy that disadvantage. 

Fairfax County

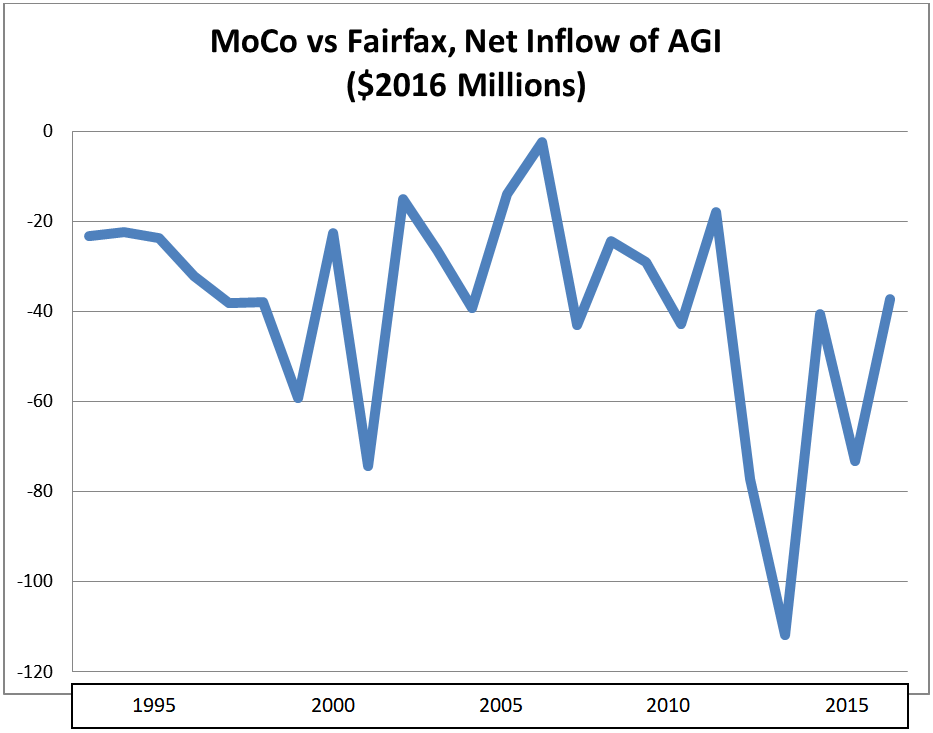
Net change in tax returns, 2006-2016: -2,382 (outflow)

Net change in adjusted gross income ($2016), 2006-2016: -$497 million (outflow)

Adjusted gross income of in-migrants ($2016), 2006-2016: $70,796

Adjusted gross income of out-migrants ($2016), 2006-2016: $93,521

Migrant income gap: Out-migrants earned 32% more than in-migrants

Fairfax has had more taxpayer flight than MoCo overall and is losing a ton of income to Loudoun ($2.5 billion over the last decade).  But in head-to-head competition, Fairfax siphons millions in taxpayer income from MoCo every year, setting a record in 2013 with a net gain of $112 million.  A big reason for Fairfax’s gains is that the people who move from MoCo to Fairfax made 32% more money than those who moved in the opposite direction over the last decade. 

Frederick County

Net change in tax returns, 2006-2016: -7,170 (outflow)

Net change in adjusted gross income ($2016), 2006-2016: -$582 million (outflow)

Adjusted gross income of in-migrants ($2016), 2006-2016: $59,150

Adjusted gross income of out-migrants ($2016), 2006-2016: $69,017

Migrant income gap: Out-migrants earned 17% more than in-migrants

MoCo’s smaller neighbor to the north has been feeding off the county for years.  Frederick’s biggest gains from MoCo occurred from 2002 through 2007 during the latter’s housing price boom.  Frederick is not siphoning off anywhere near the amount of income that Loudoun is getting from Fairfax, but the inflow of people from MoCo has helped change its county seat’s downtown, its demographics  and its politics.

Virginia

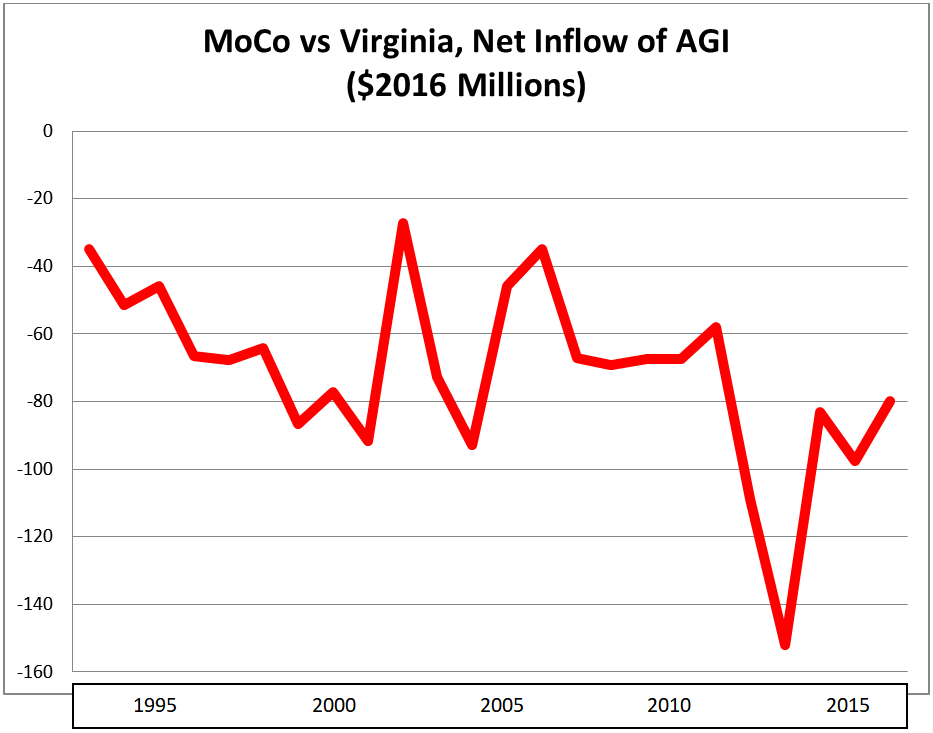
Net change in tax returns, 2006-2016: -5,638 (outflow)

Net change in adjusted gross income ($2016), 2006-2016: -$851 million (outflow)

Adjusted gross income of in-migrants ($2016), 2006-2016: $70,701

Adjusted gross income of out-migrants ($2016), 2006-2016: $83,010

Migrant income gap: Out-migrants earned 17% more than in-migrants

MoCo has lost significant amounts to Virginia over the years, with the biggest income losses occurring in 2013 ($152 million) and 2012 ($109 million).  Fairfax is the biggest culprit, followed by Loudoun and the rest of Northern Virginia.  The pace of income lost has picked up considerably since the early 1990s.

Florida

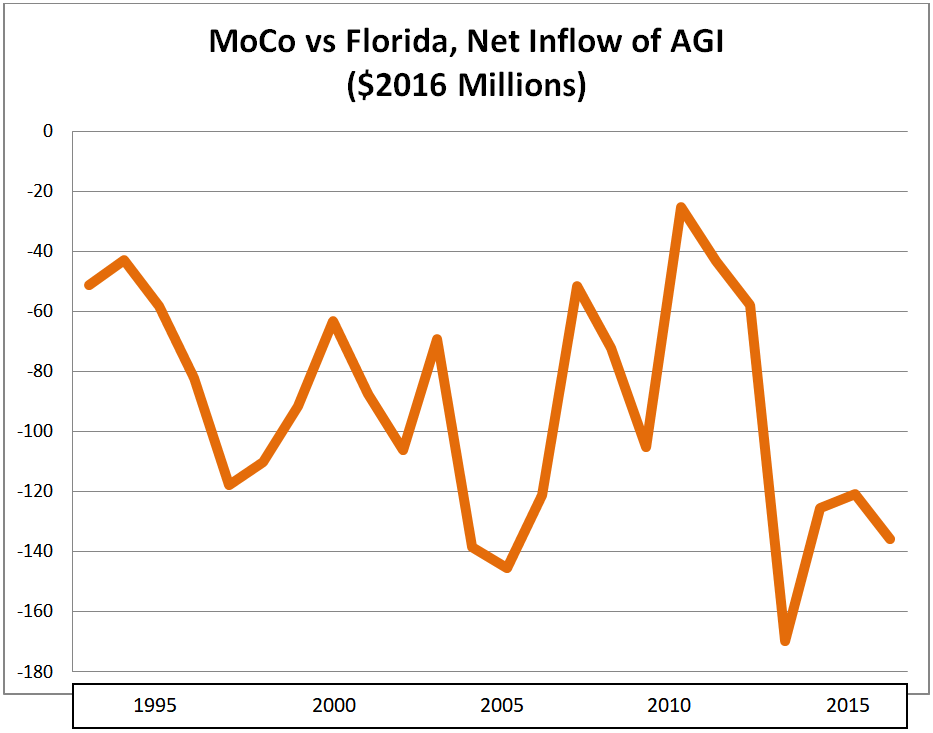
Net change in tax returns, 2006-2016: -2,769 (outflow)

Net change in adjusted gross income ($2016), 2006-2016: -$907 million (outflow)

Adjusted gross income of in-migrants ($2016), 2006-2016: $70,112

Adjusted gross income of out-migrants ($2016), 2006-2016: $132,459

Migrant income gap: Out-migrants earned 89% more than in-migrants

Everyone has heard the stories of rich people and/or retirees moving from MoCo to Florida.  Well, those stories might be true: more MoCo income has been lost to Florida than to Virginia over the last decade.  The number of people moving to Florida is less than those moving to Virginia.  But the average income of those moving from MoCo to Florida – $132,459 – is large in both absolute terms and when compared to those moving in reverse ($70,112).  One more thing: the last four years saw the biggest net loss of taxpayer income to Florida ($552 million) of any four-year period on record.

Share

Taxpayer Flight from MoCo, Part Four

By Adam Pagnucco.

In Part Three, we saw that MoCo’s problem of taxpayer flight is shared by most jurisdictions in the Washington region.  But what happens when we look at MoCo’s taxpayer inflows and outflows to and from each of its large neighbors?  From whom does MoCo gain income on net?  And to whom does MoCo lose income on net?

We looked at net gains and losses between MoCo and nine other local jurisdictions plus two states.  Let’s start with the two jurisdictions from which MoCo has net gains of taxpayer income: D.C. and Prince George’s.

District of Columbia

Net change in tax returns, 2006-2016: +1,070 (inflow)

Net change in adjusted gross income ($2016), 2006-2016: +$417 million (inflow)

Adjusted gross income of in-migrants ($2016), 2006-2016: $94,696

Adjusted gross income of out-migrants ($2016), 2006-2016: $83,038

Migrant income gap: In-migrants earned 12% more than out-migrants

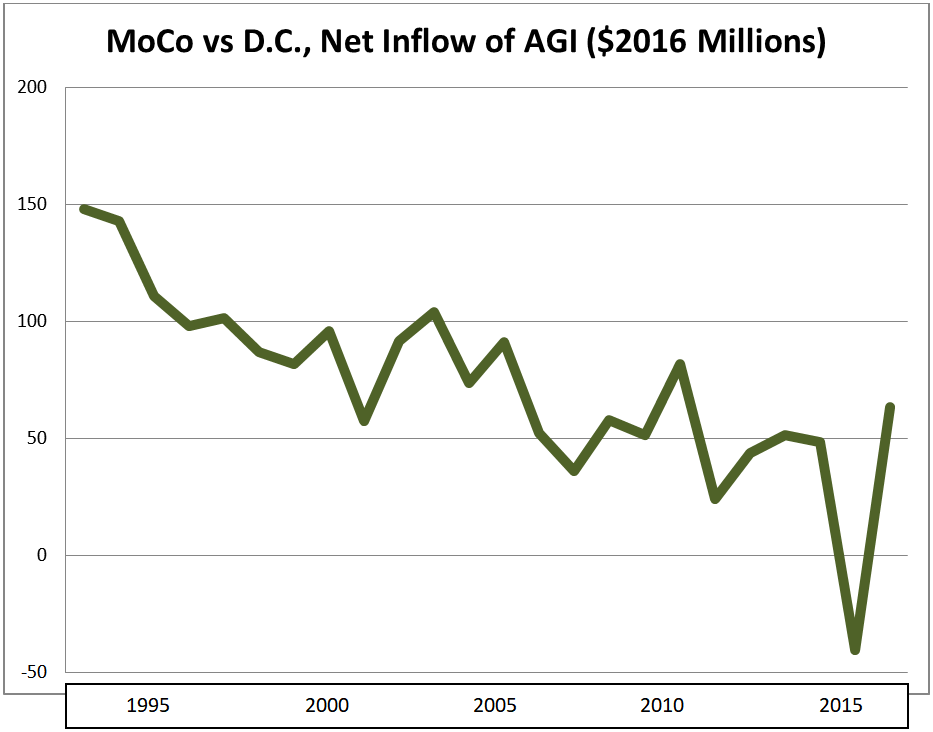
MoCo almost always drains tens of millions of dollars in taxpayer income each year from D.C.  That’s because it gets more in-migrants from D.C. than out-migrants and the in-migrants make more.  This fits a pattern of young people living in D.C. and then moving to the suburbs as their incomes grow and they are ready to have kids.  However, as D.C.’s economy has improved since the 1990s, the District’s net income flow to MoCo has diminished over time.  In 2015, D.C. even netted a gain of $40 million from MoCo, the first time the District ended up on the plus side of this ledger since this data series began in 1993.

Prince George’s County

Net change in tax returns, 2006-2016: +834 (inflow)

Net change in adjusted gross income ($2016), 2006-2016: +$39 million (inflow)

Adjusted gross income of in-migrants ($2016), 2006-2016: $42,894

Adjusted gross income of out-migrants ($2016), 2006-2016: $42,802

Migrant income gap: In-migrants earned about the same as out-migrants

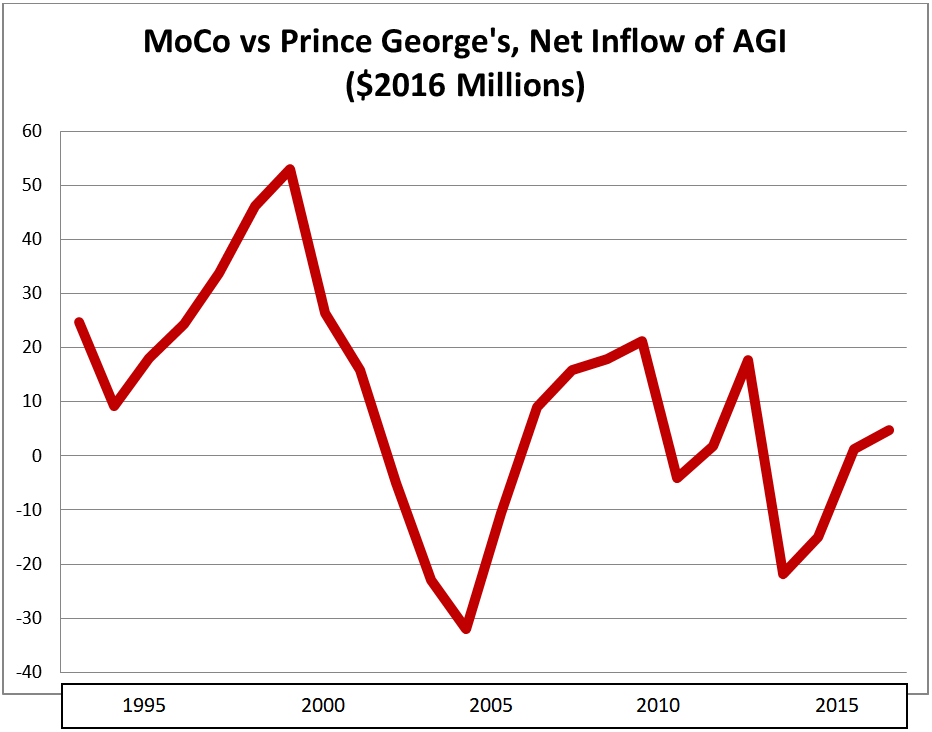
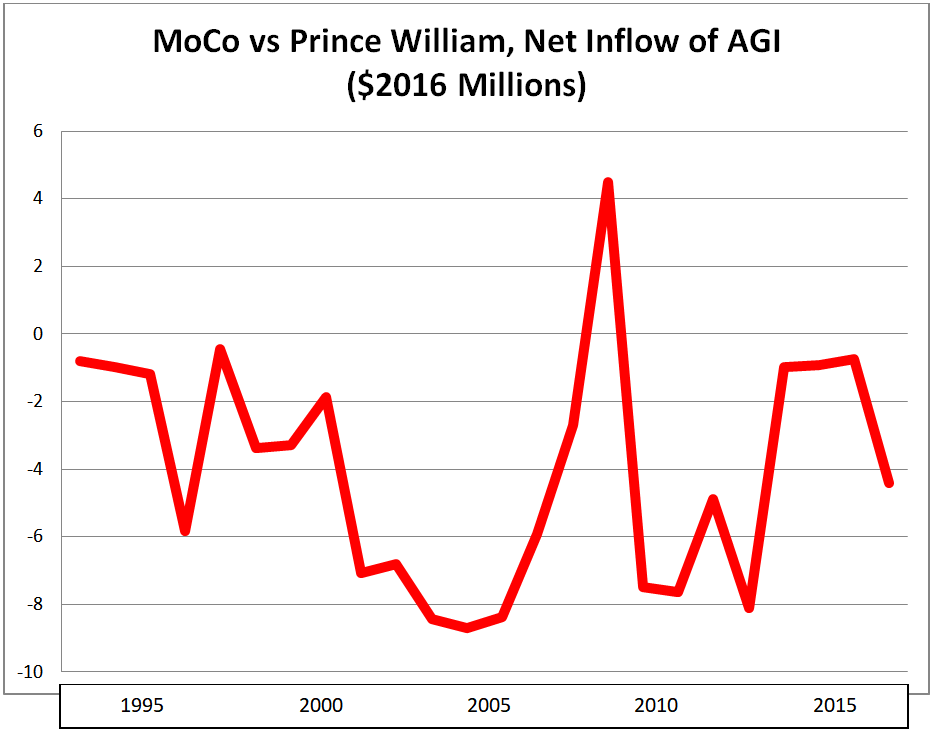
In the 1990s, MoCo consistently enjoyed positive income inflows from Prince George’s, but that began to change in the 2000s.  In the last fifteen years, MoCo lost money to Prince George’s seven times.  MoCo may still have a slight advantage but it’s very tenuous and could slip away.

Alexandria City

Net change in tax returns, 2006-2016: -346 (outflow)

Net change in adjusted gross income ($2016), 2006-2016: -$7 million (outflow)

Adjusted gross income of in-migrants ($2016), 2006-2016: $78,961

Adjusted gross income of out-migrants ($2016), 2006-2016: $73,304

Migrant income gap: In-migrants earned 7% more than out-migrants

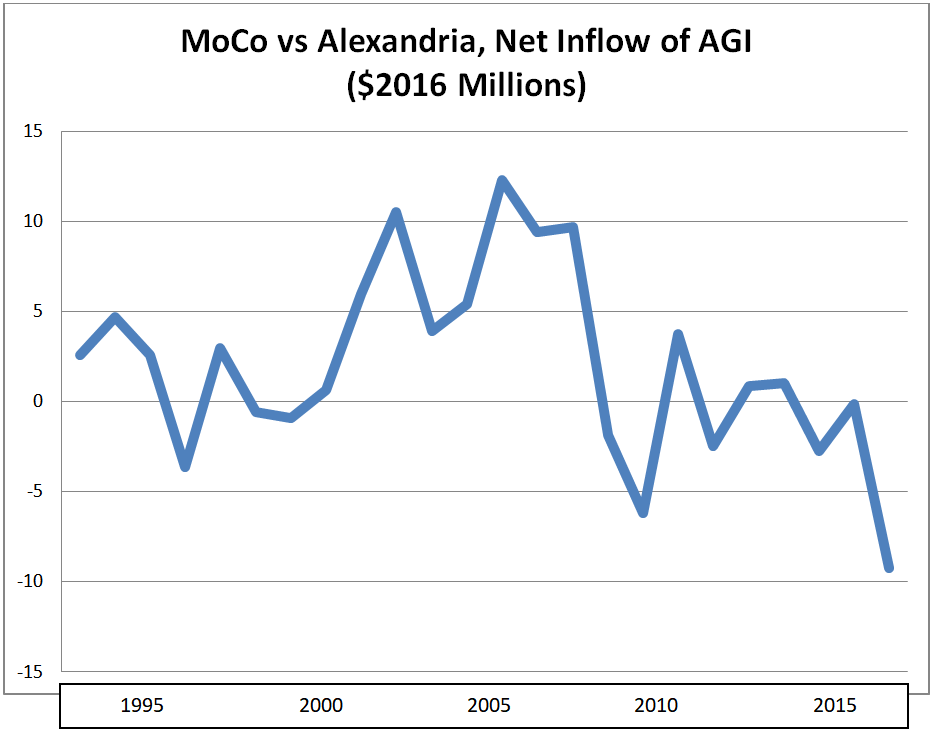
There’s not a ton of migration between MoCo and Alexandria and the two jurisdictions roughly break even, although MoCo’s balance has deteriorated a bit in recent years.

Arlington County

Net change in tax returns, 2006-2016: -1,103 (outflow)

Net change in adjusted gross income ($2016), 2006-2016: -$8 million (outflow)

Adjusted gross income of in-migrants ($2016), 2006-2016: $85,154

Adjusted gross income of out-migrants ($2016), 2006-2016: $72,852

Migrant income gap: Out-migrants earned 14% more than in-migrants

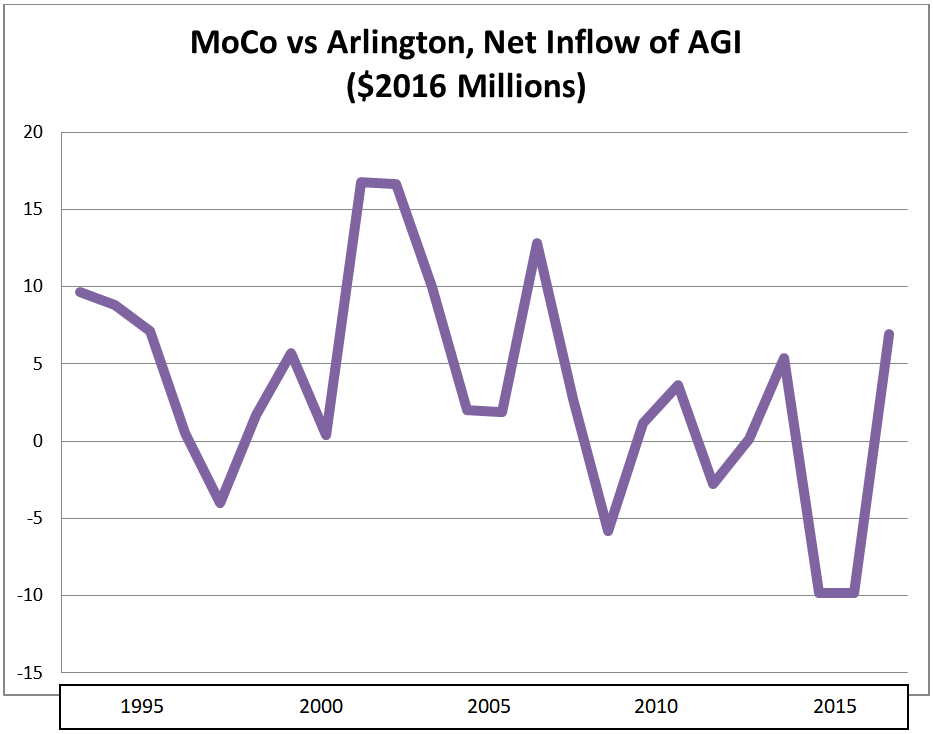
As with Alexandria, MoCo roughly breaks even with Arlington.  Again, MoCo’s balance has gotten slightly worse in recent years.

Prince William County

Net change in tax returns, 2006-2016: -289 (outflow)

Net change in adjusted gross income ($2016), 2006-2016: -$33 million (outflow)

Adjusted gross income of in-migrants ($2016), 2006-2016: $50,076

Adjusted gross income of out-migrants ($2016), 2006-2016: $57,436

Migrant income gap: Out-migrants earned 15% more than in-migrants

Prince William has received small inflows of income from MoCo that have diminished in recent years.  Most people moving between the two counties fall in the lower end of the region’s income distribution.

We will conclude tomorrow.

Share

Taxpayer Flight from MoCo, Part Three

By Adam Pagnucco.

In Part Two, we detailed how MoCo has experienced an exodus of taxpayer income since 1993.  But MoCo is not alone: many large jurisdictions in the Washington region have suffered from taxpayer flight over the last decade.

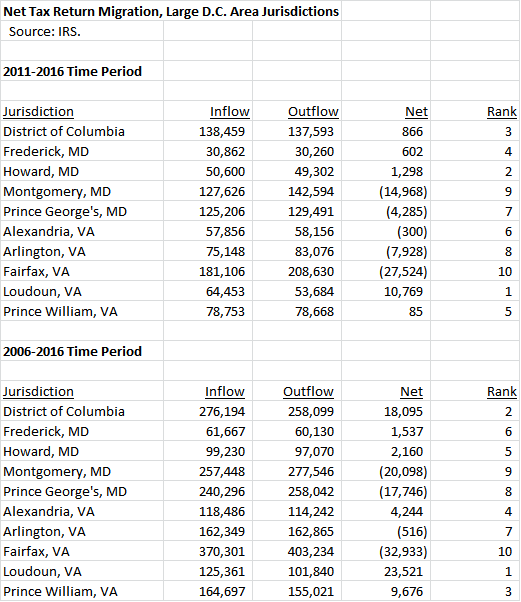
Below is a chart showing the net change in tax returns for the ten largest jurisdictions in the region.  We show net change for two time periods: the last five years (2011-2016), which include the recovery from the Great Recession, and the last ten years (2006-2016), which include the pre-recession peak, the recession itself and the recovery afterwards.  MoCo ranks nine out of ten in both periods with only Fairfax faring worse.  Loudoun is the only jurisdiction showing significant in-migration in the last five years while D.C. was comparable to Loudoun over the last ten years.

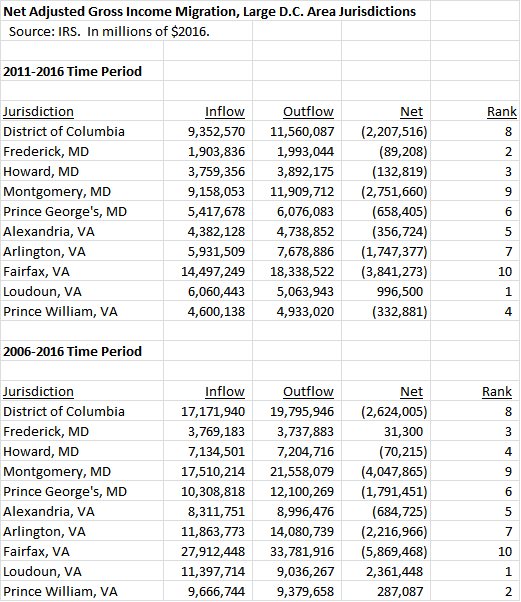
Next, we show the net change in adjusted gross income (AGI), measured in 2016 dollars, over the two periods.  Once again, MoCo is the second-worst jurisdiction in the region with only Fairfax trailing.  Notably, only Loudoun had a net inflow in the last five years and Loudoun, Prince William and Frederick had net inflows in the last ten years.

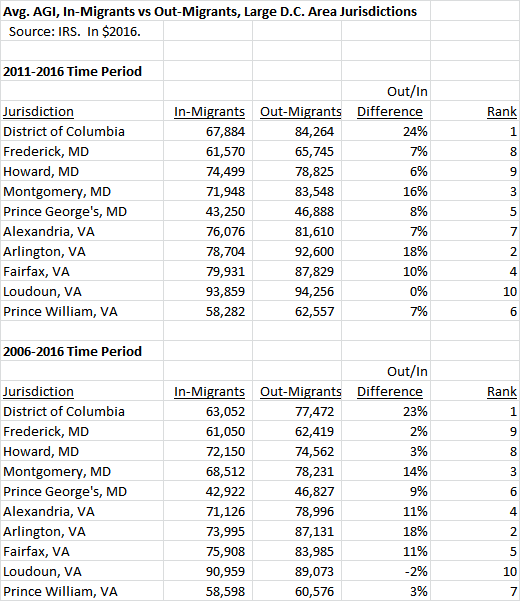
Finally, we show the average AGI of in-migrants vs the average AGI of out-migrants over the two periods.  In every jurisdiction except Loudoun (during the 2006-2016 period), in-migrant AGI was lower than out-migrant AGI.  MoCo’s gap was the third largest.

This is a bad picture for MoCo and not a very good one for the region as a whole.  What is going on here?

First, as has been previously noted by George Mason Professor Stephen Fuller, the entire Washington region’s economy has slowed down since the Great Recession.  That is reflected in the deterioration of the numbers above between the last five years and the last ten years.  The “new normal” has not been kind to anyone in this area and that includes MoCo.

Second, Fairfax has been affected by taxpayer income losses even more than MoCo.  Like MoCo, Fairfax is a huge county with huge bills to pay and nightmarish traffic congestion.  But Fairfax also shares a long land border with Loudoun, which has grown dramatically in past decades and is currently the nation’s wealthiest county.  Of the $5.9 billion that Fairfax lost to taxpayer flight in the last decade, $2.5 billion went to Loudoun.

Third, in addition to the number of taxpayers leaving on net, MoCo’s problem is the big gap in income between those coming in and those leaving.  One would expect to see such a gap in places like D.C. and Arlington, the two jurisdictions with the biggest income gaps shown above.  That’s because both places attract lots of young people who work in and near downtown D.C. and then move out when they earn more and have kids.  That explanation does not work well for MoCo, which has a much lower percentage of young people in its population than D.C. or Arlington.  And yet MoCo’s gap, which is third in the region, has been significantly bigger than the gaps in Fairfax and Howard, two jurisdictions of similar wealth, in the last five years.

We have seen how MoCo compares to its large neighbors in tax migration overall.  But what about direct inflow and outflow relationships?  To whom does MoCo lose income?  And from whom does MoCo gain income?  We will begin examining that in Part Four.

Share

Taxpayer Flight from MoCo, Part Two

By Adam Pagnucco.

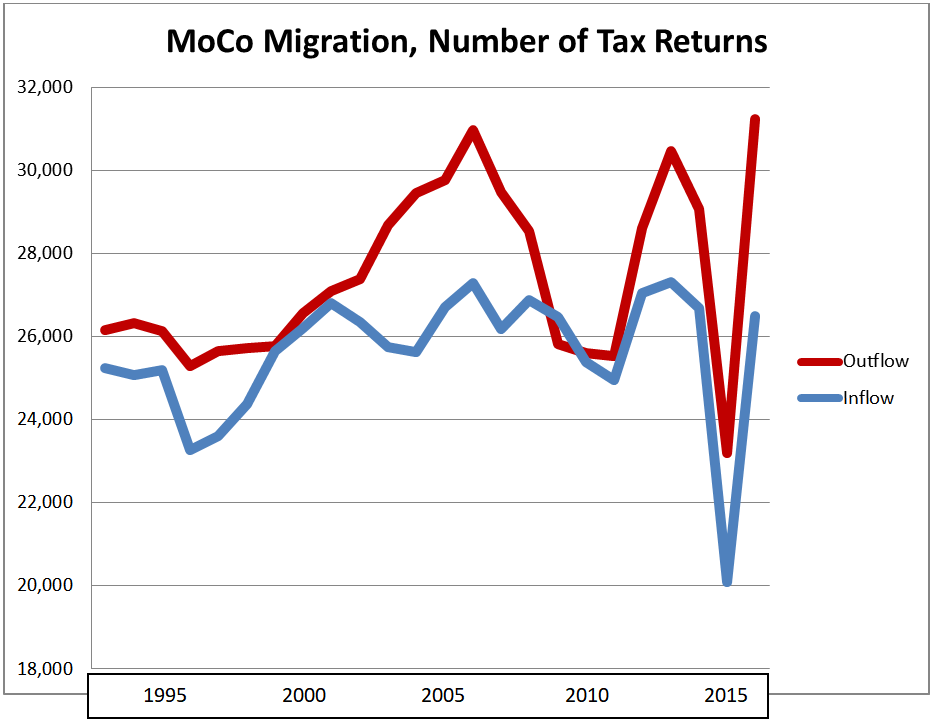
As we stated in Part One, the IRS tracks the inflow and outflow of returns, exemptions and adjusted gross income (AGI) for all states and counties.  Comparable data starts in 1993 and continues through 2016.  Here is what that data looks like for Montgomery County.

First, let’s look at the inflow and outflow of tax returns, which approximate the number of households.

For most years, the number of tax returns leaving has exceeded the number of tax returns entering.  The chief exceptions have occurred during economic downturns, especially in the aftermath of the Great Recession.  We are skeptical of the data for 2015: there is no apparent explanation for the enormous drop in both inflow and outflow in that one year.  We saw those drops in every local jurisdiction we examined and they did not seem to produce huge swings in net changes, as we will see.

Below is the net change of tax returns (inflow minus outflow).

The net migration of tax returns – inflow minus outflow – tends to shrink during recessions but it is almost always negative.  Since 1993, there was only one year when inflow exceeded outflow – 2009, when tax return migration was +658.  In 2016, outflow exceeded inflow by 4,748 returns – the worst year on record.  The migration of exemptions, in and out, has followed similar patterns.

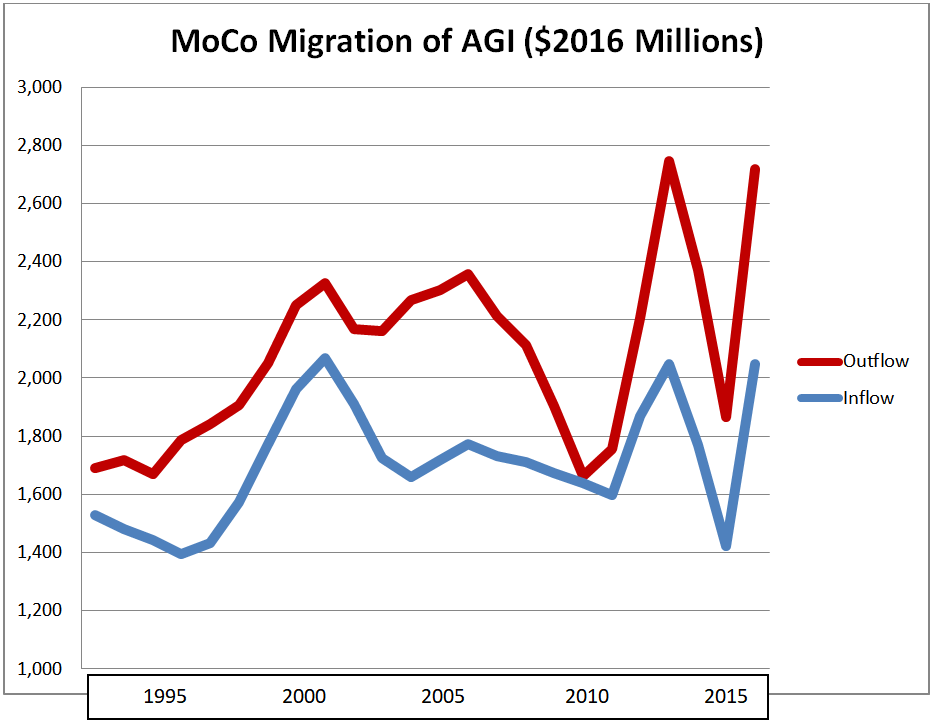
Now let’s look at the migration of adjusted gross income (AGI).  The chart below shows the total AGI of taxpayers migrating into Montgomery County and out of Montgomery County, adjusted for inflation and measured in millions of 2016 dollars.

Outflow has exceeded inflow in every year.  Note, once again, the fluky data for 2015.  Below is the net change, adjusted for inflation, in millions of 2016 dollars.

Every year has seen a net loss of adjusted gross income.  The year which came closest to a wash was 2010, when $24 million was lost.  The worst losses on record were in 2004 ($608 million), 2013 ($697 million), 2014 ($601 million) and 2016 ($672 million).  Over the five-year period of 2011 through 2016, $2.75 billion of taxpayer income left Montgomery County on net.

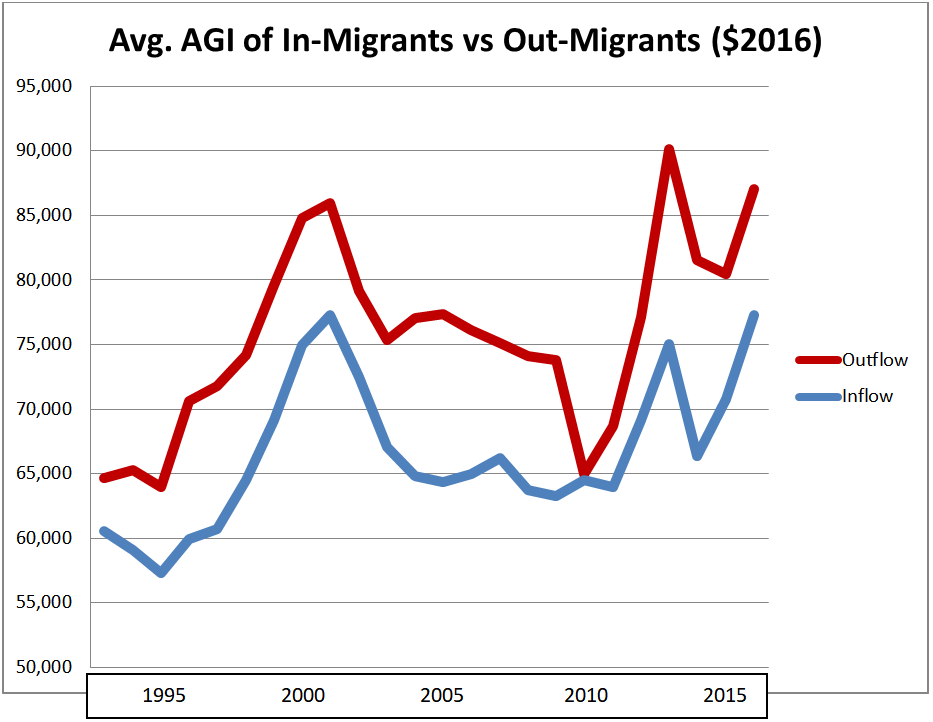
The IRS data tells one more story.  Thousands of taxpayers enter MoCo and thousands leave MoCo every year.  But on average, those who enter have lower adjusted gross incomes than those who leave.  The chart below shows the average AGI of in-migrants and out-migrants in 2016 dollars.

Since 1993, out-migrants have had greater adjusted gross incomes than in-migrants by an average of 14%.  In the 2011 to 2016 period, the average AGI of in-migrants was $71,707 in 2016 dollars while the average AGI of out-migrants was $83,262 – a gap of 16%.

One can only imagine the impact on the county’s budget when hundreds of millions of dollars in taxpayer income leave every year.

Montgomery County is not the only jurisdiction in the region to see a net exodus of taxpayer income.  We will examine how MoCo compares to its large neighbors in Part Three.

Share

Taxpayer Flight from MoCo, Part One

By Adam Pagnucco.

We have been printing a ton of posts about the economy on Seventh State, including discussions of our employment and income growth, our rate of business formation, our increasing reliance on corporate welfare to attract and retain employers, the role of economic growth in creating the county’s $120 million budget shortfall and reactions from County Executive candidates and gubernatorial candidate Kevin Kamenetz. Let’s be clear: as we wrote eleven years ago, without economic growth, we will not be able to meet our needs without more tax hikes in the future.  And today, we begin presenting the following facts.

More taxpayers have been leaving Montgomery County than entering it for a long time.

The taxpayers who are coming in make less money than the ones who are leaving.

And while this has been going on for decades, it is now worse than it has ever been.

Our basis for these statements is a data series on tax migration maintained by the Internal Revenue Service (IRS).  As the IRS explains:

Migration data for the United States are based on year-to-year address changes reported on individual income tax returns filed with the IRS. They present migration patterns by State or by county for the entire United States and are available for inflows—the number of new residents who moved to a State or county and where they migrated from, and outflows—the number of residents leaving a State or county and where they went. The data are available for Filing Years 1991 through 2016 and include:

  • Number of returns filed, which approximates the number of households that migrated

  • Number of personal exemptions claimed, which approximates the number of individuals

  • Total adjusted gross income, starting with Filing Year 1995

  • Aggregate migration flows at the State level, by the size of adjusted gross income (AGI) and age of the primary taxpayer, starting with Filing Year 2011.

For every state and county in the U.S., the IRS tracks both inflow and outflow of returns, exemptions and adjusted gross income.  But that’s not all: the IRS reports the origin and destination jurisdictions of these flows.  So data users can see a situation in which County X has a net inflow overall but has a net inflow from County Y and a net outflow to County Z.  The directions of these flows, in an out, become apparent when the data is downloaded and crunched.

Over the next few days, we will publish the following statistics.

Montgomery County’s inflows and outflows of returns and adjusted gross income from 1993 (the first year in which comparable data is available) to 2016.

Inflow and outflow statistics for MoCo and its large neighbors – D.C., Frederick, Howard, Prince George’s, Alexandria, Arlington, Fairfax, Loudoun and Prince William – to provide perspective.

A listing of destination and origin jurisdictions of taxpayer migration between MoCo and its neighbors.  This will identify MoCo’s comparative advantages and disadvantages in taxpayer flow across the region.

Tomorrow, we will proceed.

Share