Tag Archives: primaries

MoCo Voters are Less Liberal Than You Think

Today, I am pleased to present a guest blog by Adam Pagnucco:

Montgomery County is the home of Maryland progressivism. It was the first county in the state to ban smoking in restaurants, enact a living wage law, pass a bag fee, ban private use of pesticides, create a local Earned Income Tax Credit and protect transgender residents from discrimination. It has the biggest county budget of any jurisdiction and has the largest Health and Human Services budget BY FAR. Every single state and county-level elected official is a Democrat and almost all of them are strong progressives. So this must all be supported by an overwhelmingly liberal voting base, right?

Not exactly.

MoCo’s political system is underwritten by three things. First, it has closed primaries that are limited to party members. Unaffiliated voters can only vote for non-partisan offices (like school board seats) in primaries. Second, because the county is so heavily tied to the federal government, the Republican Party is tainted by its association with the tea party, right-wing demagogues, government shutdowns, debt limit crises and the sequester. This is a huge burden on the county’s GOP. Third, turnout in the primaries is low and falling. A grand total of 42,692 Democrats voted in every one of the last three gubernatorial primaries (2006, 2010 and 2014), which determine the election of the County Executive, County Council, State Senators and Delegates. That’s just four percent of the population. These folks get swamped by election-time mail and email and the county leaders owe their election to them.

These three factors have together produced a closed political system that is accessible only to Democrats, and very liberal Democrats at that. But the general electorate is much more diverse. Over the last three gubernatorial cycles, non-Democrats accounted for roughly 40% of the county’s general election turnout. And the Democrats are not necessarily all liberals. Council Member Phil Andrews ran for County Executive last year on an unabashed anti-tax, anti-union platform. In the summer of 2013, he was polling in the mid-teens among Democrats. In the 2014 Democratic primary, he received 22% of the vote. The fact that more than a fifth of primary Democrats embraced an anti-tax, anti-union candidate should give progressives pause.

But the real evidence for the sentiments of the voters comes from how they vote on ballot questions and charter amendments. These questions are decided in the general elections, not the primaries, and voters outside the Democratic four percent get to play. Consider the last three important county-level questions.

The Ficker Amendment, 2008

Former basketball heckler and perennial right-wing candidate Robin Ficker placed a charter amendment on the ballot that required all nine County Council Members to approve any property tax increase that would exceed the rate of inflation. Similar amendments had failed in the past. The County Executive, the entire County Council and a large progressive coalition spearheaded by labor opposed it. But the same general electorate that gave 72% of its vote to Barack Obama for President also approved the Ficker Amendment by a 51-49 margin.

The Ambulance Fee, 2010

The ambulance fee, which was intended to be paid by insurance companies to supplement the county’s Fire and Rescue budget, was a top priority of the County Executive and the county employee unions and it was passed by the Democratic County Council. It was opposed by the Volunteer Fire Fighters, Council Member Phil Andrews and the Republican Party and was petitioned to the ballot. The reasons for opposition differed; the volunteers worried that the fee would deter people in need from calling ambulances, while others simply opposed a new government fee. The Executive and the unions campaigned hard to pass it. The general electorate rejected the fee by a 54-46 margin.

Police Effects Bargaining, 2012

The politics of this one were a bit murky. The Democratic County Council unanimously passed a bill repealing the right of the police union to bargain over the effects of management decisions and the Executive supported it. Both the Democratic and Republican parties also supported the legislation. But labor vehemently opposed it and responded by picketing county Democratic Party events and eventually taking over part of its Central Committee. This was a big test for labor’s power in the county and the police union and its allies went all out to defeat the legislation. The general electorate upheld it by a 58-42 margin.

In every case, when general election voters were asked to weigh in, they chose what was arguably the less progressive position. And in every case, they went against the position of the county government employee unions.

The county is not a monolith. It’s a big jurisdiction with more than a million people and its various sub-components have different political leanings. For example, Takoma Park is famous for its liberalism, but Damascus leans towards the GOP. I totaled up the precinct results of all three ballot questions for each city and town in the county to determine which ones went for the more progressive positions (no on the Ficker Amendment and the police legislation, yes on the ambulance fee) and which ones did not. Here are the results.

Ballot Voting

Not a single part of the county adopted the more progressive position all three times. Only two areas – Cabin John and Takoma Park – sided with the more progressive position twice (opposing the Ficker Amendment and supporting the ambulance fee). Ten areas – Burtonsville, Darnestown, Derwood, Dickerson, Gaithersburg, Laytonsville, Montgomery Village, North Potomac, Olney and Sandy Spring – voted against the progressive position all three times. The referendum on effects bargaining was influenced by the fact that many police officers live in Upcounty areas like Clarksburg, Damascus, Germantown and Poolesville. Many presumably liberal areas in Downcounty favored reducing the bargaining rights of the police union. Bethesda, Cabin John, Chevy Chase, Leisure World and Potomac went against labor by two-to-one or more. Even Takoma Park voted against labor by 58-42%. Here’s an interesting fact: in these three instances, the only time the general electorate agreed with the Democratic County Executive and a majority of the Democratic County Council was when they wanted to reduce public employee bargaining rights. Is that truly a liberal voter base?

So the politics of county voters are considerably more diverse than their progressive elected leaders. What does that mean? It’s highly unlikely that the Democrats will be removed from power. The county’s Republicans are too weak, too underfunded and in many instances too conservative to pick up more than a seat or two (if that). And there is no other organized political movement to take on the Democrats. The real danger is that the business community, conservatives and single-issue groups will seize the voter tools available to them – charter amendments and ballot questions – and begin overturning progressive legislation and limiting the authority of county government on a strategic basis. Given the past history of the general electorate and depending on the issue, they just might succeed.

Share

CD8: Where are the Voters?

Building on Adam Pagnucco’s analysis from yesterday, I thought it would be great to delve into voter turnout in past Democratic primaries within the Eighth Congressional District. My gratitude to the reader who provided me with this extremely interesting registration and turnout data.

Registered Democrats by State Legislative District

So where do registered Democrats live and which ones are more likely to vote? The first table shows the current number of registered Democrats along with past primary turnout broken down by state legislative district. Note that the data include only the portion of state legislative districts within CD 8.

TO1 Past VH x SHD

D16 holds 19.8% of registered Democrats and an even higher share of actual voters. In Democratic primaries from 2008 through 2014, D16 residents formed at least 21.0% and as much as 22.2% of voters. D16 is the most highly educated district in Maryland–and quite possibly the country–and studies show that education is more strongly related to voter turnout than any other factor. These numbers should encourage Del. Ariana Kelly.

In contrast, these numbers are less favorable to Sen. Jamie Raskin (D-20). Though D20 is chock-a-block with registered Democrats, not all of D20 is in CD8. As a result, D20 is home to just 16.9% of registered Democrats in the Eighth, probably less than many expect though still high.

Moreover, turnout within the D20 portions of CD8 is erratic. In 2014, D20 Democrats voted at a relatively high rate in the primary and constituted 17.6% of CD 8 Democratic primary voters. But their share in the district never exceeded 15.8% in the Democratic party primaries held from 2008 through 2012.

The second biggest stronghold of potential Democratic primary voters in CD 8 is D18, as it is home to 18.8% of all of registered Democrats. Turnout effects are smaller than in D16 or D20 with the share of D18 Democrats among all of the Eighth’s primary voters ranging from just 18.2% to 19.6%.

Del. Kumar Barve (D-17) suffers not only from the split in his district between the Sixth and Eighth Congressional Districts but the relative paucity of Democrats. Barve currently represents just 8.5% of the Eighth’s registered Democrats. They also tend to under perform on primary day, as their share of CD 8 voters ranged from 7.7% to 8.2% in the past four Democratic primaries.

Finally, it is worth noting that 17.9% of registered Democrats living in the Eighth don’t live in Montgomery County, so candidates will want to spend time and advertise in these areas. Fortunately for candidates, only around 8% of registered Democrats live in Carroll County, located in the Baltimore media market.

The rest live in the very expensive Washington media market where the vast majority of viewers are not registered Democrats living in the Eighth District. Less pricey social media will be extremely popular this year. But candidates cannot forget traditional media, as the primary electorate skews very old.

Registered Democrats by State Legislative and County Council Districts

The second table breaks down the share of registered Democrats by state legislative district and county council district:

TO2 Dem RV x SHD x County Council

Montgomery Councilmember Roger Berliner (D-1) represents 26.9% of CD 8’s Democrats but he has declined to enter the race. However, Montgomery County District 5 holds 22.5% of registered Democrats in the Eighth–a higher share than any state legislative district. Rumored congressional candidate and former Councilmember Valerie Ervin represented a slightly differently configured version of District 5.

At-Large Montgomery Councilmember Nancy Floreen has publicly mused about a run for Congress. She represents 81.8% of registered Democrats in CD 8, an overlap that any other of the rumored candidates would envy. But, as Adam pointed out, she has only run in the multimember at-large district, so the congressional race would be a different. Nevertheless, Floreen likely starts with higher name recognition than other candidates.

Likely Voters by State Legislative and County Council Districts

The final table breaks down the share of Democrats who voted in at least two of the past four primaries by state legislative district and county council district:

TO3 Dem 2 of 4 x SHD x County Council

Interestingly, this table reveals that D16 holds more people who are likely to vote in the primary than Council District 5. The high rates of turnout among D16 residents would bring Del. Kelly to parity with former Councilmember Ervin in terms of likely voters previously represented even though Ervin represented far more people.

Turnout only accentuates the Montgomery tilt of CD 8, as it is home to 82.5% of people who voted in at least one-half of the past four primaries. Among the remainder, 10.1% live in Frederick County as compared to 7.4% in Carroll County.

Based on this table, the most desirable pieces of real estate to have represented before in terms of Democratic primary turnout are:

1. Montgomery County (Floreen)
2. Montgomery County Council District 1
3. State Legislative District 16 (Kelly)
4. Montgomery County Council District 5 (Ervin)
5. State Legislative District 18
6. Montgomery County Council District 4
7. State Legislative District 20 (Raskin)
8. Montgomery County Council District 3
9. State Legislative District 19
10. Frederick County
11. State Legislative District 4
12. State Legislative District 17 (Barve)

Still, as Adam points out, all candidates have a lot of work to do to get known to most voters. Floreen and Kelly, who represent the most voters, have run only in multi-candidate contests. Other candidates have good bases but have run only in lower visibility races and in a portion of CD 8.

The keys to a good campaign remain the same: message, money, volunteers, and organization. Candidates need to have a message to sell to voters. They need money to pay for media to get it across and volunteers to spread the word and help canvass. But none of it matters if the candidate cannot run a a good strategic campaign.

Share

CD8 is Wide Open

Today, I am pleased to present a guest post from Adam Pagnucco:

Long-time District 8 Congressman Chris Van Hollen is now running for the U.S. Senate. Who will succeed him? No one knows because this race is wide open. That’s right, wide open.

Announced or potential candidates include At-Large Councilmembers Nancy Floreen and Hans Riemer, District 20 State Senator Jamie Raskin, District 17 Delegate Kumar Barve, District 16 Delegate Ariana Kelly, former District 5 County Council Member Valerie Ervin, former District 20 Delegate candidate Will Jawando and former WJLA anchor and current Marriott executive Kathleen Matthews. All except Matthews have campaign records. None have run campaigns that approach anything close to the scale of a congressional race.

Consider the following data.

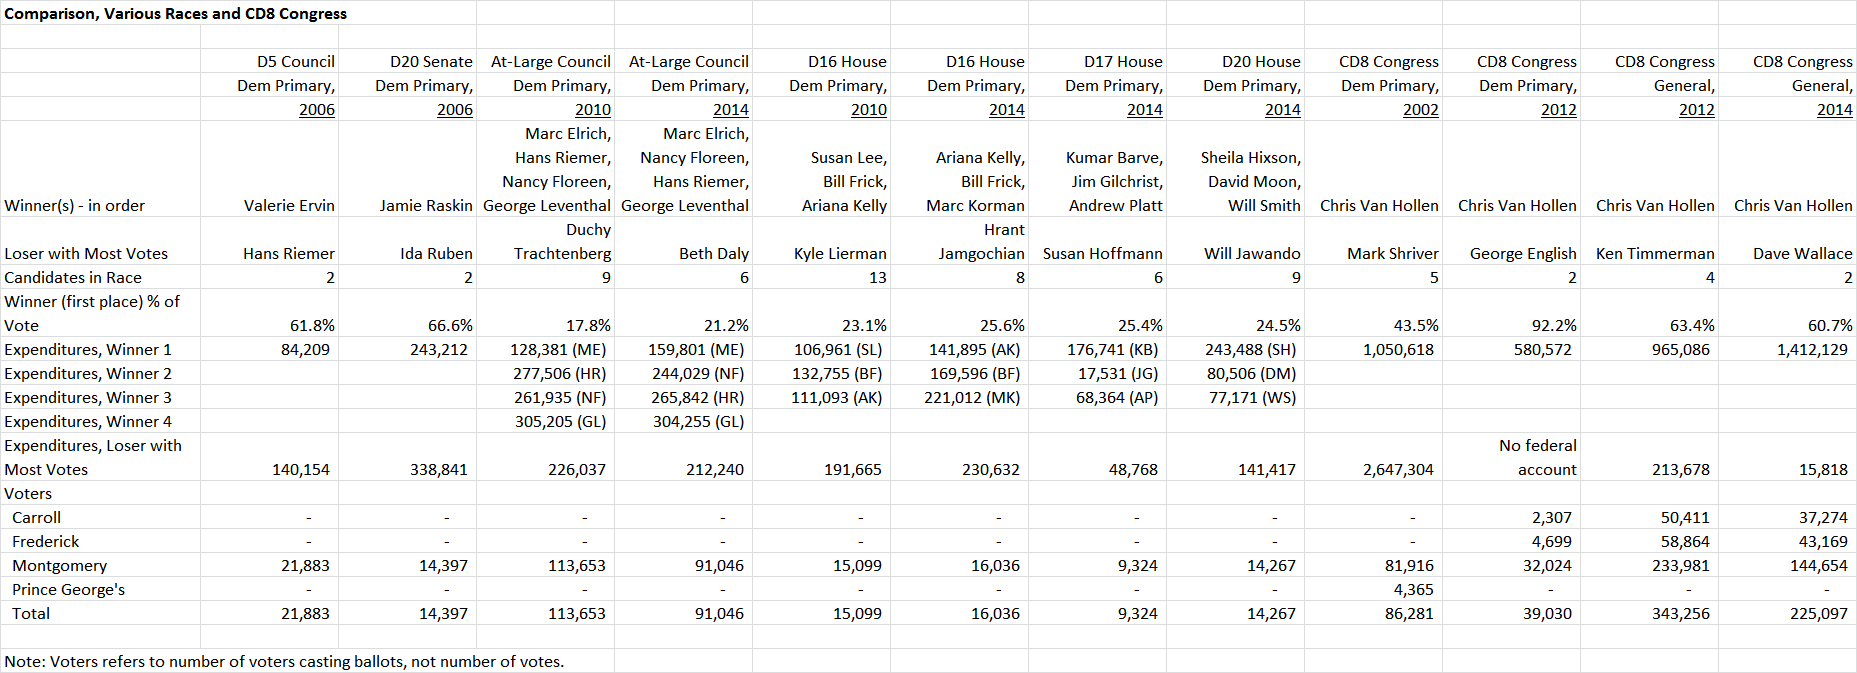
CD8 Comparison

Campaign Spending

In the CD8 2002 primary, Chris Van Hollen spent $1.1 million and won. Mark Shriver spent $2.6 million and lost. None of the prospective candidates in the current CD8 have demonstrated that kind of monetary capacity. Raskin, Riemer and Floreen spent between 200k and 300k on their competitive races. Barve came close to that level in 2014. Ervin has never spent more than 100k in a campaign. All of these candidates would need to dramatically increase their fundraising activity and it’s hard to see that any one has a significant advantage over the others. Matthews, who may be able to draw on self-financing, national Dem money and corporate money, may be an exception.

Size of Electorate

It’s tricky to forecast the size of the CD8 Dem primary electorate because the district was changed radically in 2012 and it does not have a recent experience of primary competition. Van Hollen faced no-names in both the 2012 and 2014 primary and general elections. In the 2002 primary, when the district was almost entirely in MoCo, 86,000 Dems voted. That was a high turnout year for Dems in terms of gubernatorial elections, but 2016 is a presidential year and many more Dems could turn out. In 2012, a presidential year, just 39,000 Dems voted in the primary, as Van Hollen clobbered an opponent without a federal account and there was no meaningful competition in the Presidential and U.S. Senate races. A combination of competition in the U.S. Senate and CD8 races, plus support for Hillary Clinton, could drive turnout in the 2016 CD8 Dem primary north of 100,000.

Among the possible candidates in the CD8 primary, only Nancy Floreen and Hans Riemer have experience running in an electorate that large. State legislative races tend to draw out 7,000-16,000 Democratic primary voters. But Floreen and Riemer don’t necessarily have an advantage because their races are fundamentally different from congressional contests (more below).

Multiple-Vote vs One-Vote Races

A congressional race has one similarity to a State Senate race: voters only get to vote for one candidate. In House of Delegates races (at least in MoCo), voters can vote for up to three candidates. In Council At-Large races, they can vote for up to four. These are very different dynamics.

In a multiple-vote race, a candidate can be no one’s first choice, but can be the second or third choice of a lot of people and still win. Such a candidate would do poorly in a one-vote race like Congress. Even though Floreen and Riemer have won countywide, many of their voters are not voting for them. In 2010, 113,653 MoCo Democrats voted in the primary. Riemer received 40,493 votes (36%) and Floreen received 39,500 (35%). In 2014, 91,046 MoCo Democrats voted in the primary, which was notably less competitive than it was in 2010. Riemer received 49,932 votes (55%) and Floreen received 52,924 votes (58%). The number of voters who would rate either Riemer or Floreen as their first choice would be FAR fewer and would be closer to the total of one of the State Senators.

For what it’s worth, Floreen finished first in 32 of the 138 CD8 precincts located in Montgomery County in 2014. Riemer finished first in 11. At-Large Council Member Marc Elrich, who finished first in 90 CD8 precincts, has shown no interest in a Congressional race.

Delegates have similar problems. Barve and Kelly finished first in their respective House races, but the number of their voters who would have picked them as a first choice is unknowable short of a contemporaneous poll.

District Overlap

State legislators do not enter this race on equal footing. District boundaries and voting patterns give some an advantage over others. Delegate Ariana Kelly benefits from the fact that her district has more actual primary voters in CD8 than any other MoCo state legislative district. In terms of cards cast on 2014 primary election day by residents of CD8, Kelly’s District 16 led with 14,114, followed by District 18 (12, 072), District 20, home of Senator Jamie Raskin and Will Jawando (9,331), District 19 (6,948), District 17, home of Delegate Kumar Barve (4,929), District 14 (3,302) and District 15 (442). Barve is handicapped by the fact that 42% of voters in his district reside in CD6, not CD8.

Women

Fifty-nine percent of MoCo Democrats are women. That figure applies to registered Dems, voting Dems and “super-Dems,” or Dems who always vote. This is not necessarily a prohibitive advantage for female candidates. But if one or two strong women face off against a male-dominated field, it’s possible that this factor could act as something like a tiebreaker. A savvy female candidate might point out that with U.S. Senator Barbara Mikulski’s retirement and Rep. Donna Edwards’ entry into the Senate race, the state could be facing the very real prospect of an all-male congressional delegation.

Presidential Year vs. Gubernatorial Year Turnout

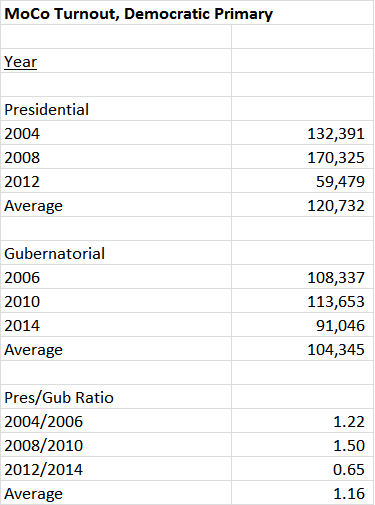
Presidential year Democratic primaries tend to attract higher turnout than gubernatorial year Dem primaries. Below are stats on how many MoCo Dems voted in the primary over the last six elections (both presidential and gubernatorial). With the glaring exception of 2012, when there was little or no competition in the presidential, U.S. Senate and CD8 races, presidential year turnouts tend to be higher. That means in a presidential year CD8 race, there will be tens of thousands of Democratic voters who have not voted in gubernatorial races and do not know their state senators, delegates or councilmembers. Communicating with these people will be a significant challenge for any candidate. Also, anywhere from a sixth to a fifth of the CD8 primary electorate will be residents of Carroll and Frederick Counties.

MoCo Turnout Dem Primary

Bottom Line

There are no favorites in this field. No candidate has proven that he or she can raise the money for a congressional campaign. The at-large County Council candidates run across a big geography but not in one-vote races. State legislators have small districts (at least compared to CD8) and delegates run in multiple-vote elections. Tens of thousands of non-gubernatorial and non-MoCo voters will have no idea who any of the candidates are and they will need some attention.

Wide open, folks. This contest is wide open.

Share

Why Polarization?

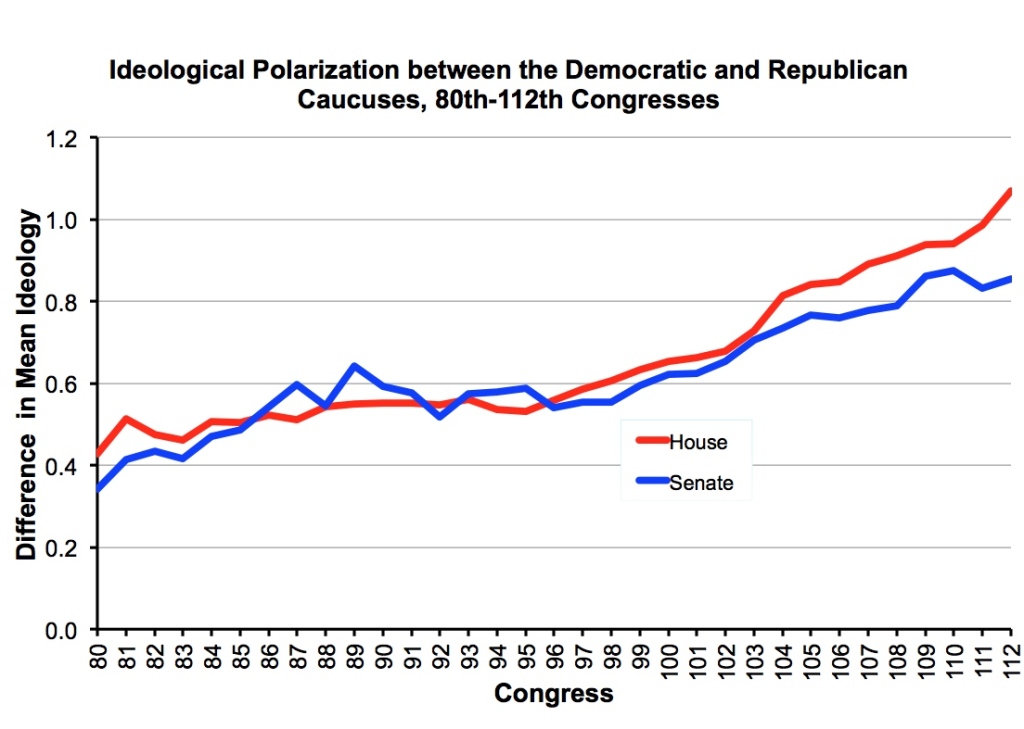
In the U.S., Democratic elected officials have become steadily more liberal while Republican elected officials have marched even faster in the conservative direction. As a result, polarization in the Senate and House of Representatives has increased:

PolarCong

The graphs show the difference in ideology between the average Democrat and average Republican over time–zero suggests no average difference in ideology according to the NOMINATE scores, which are widely used in political science. (UCSD Prof. Gary Jacobson, one of the country’s very top experts on Congress, kindly shared versions of these graphs with me.)

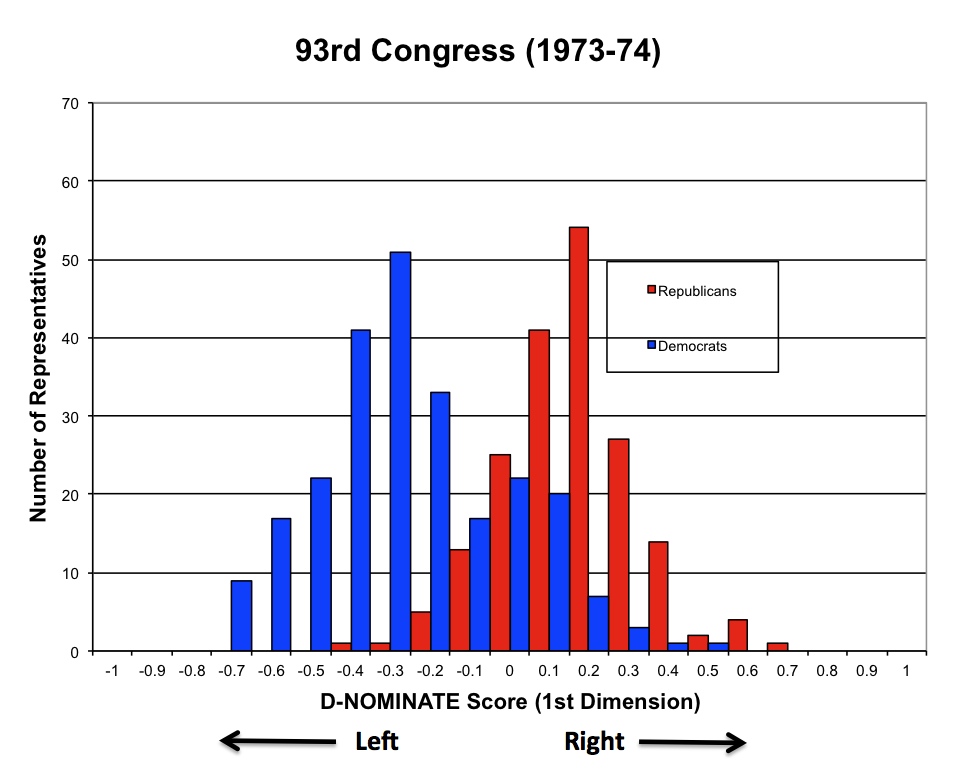
The increased polarization has resulted in the decimation of moderates in the House. Here is the distribution of representatives by party and ideology in the 93rd Congress:

Jacob93

According to the measure used here, right on the horizontal axis (i.e. more positive numbers) equates to greater conservatism while left on the same axis equates to liberalism (i.e. more negative numbers). Representatives with scores close to zero are relatively moderate.

In 1973-4, while Democrats tended to be more liberal than Republicans, there was still a lot of overlap between members of the two parties. A fair number of Republicans are more liberal than some Democrats. Similarly, many Democrats are more conservative than their Republican colleagues.

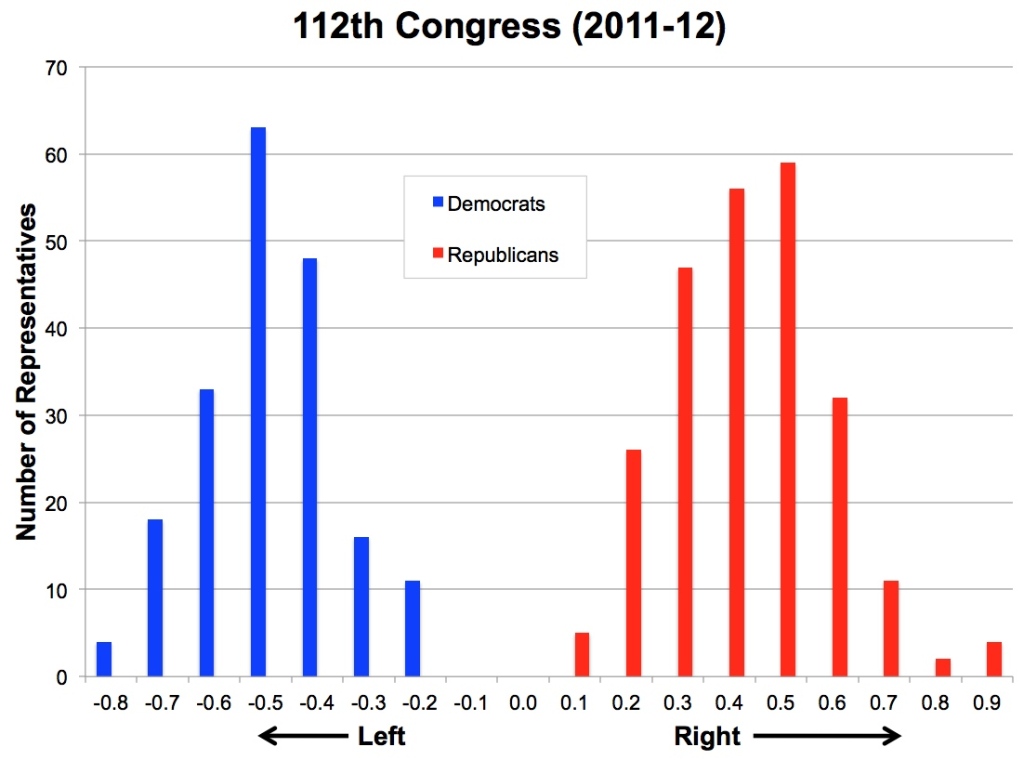
Now, look at the distribution for the House in 2011-12:

Jacob112

Not only is there no overlap between the two parties, there is even distance between the most liberal Republican and the most conservative Democrat. No wonder it is so hard to form bipartisan coalitions that can produce legislation in our divided government.

The new Congress will be even more polarized. The Democrats who lost tended to be among the most conservative members, such as Rep. Barrow from Georgia. Newly elected Republicans also tend to be more conservative than the colleagues that they replace.

Overall, both parties have become more extreme. The data indicates, however, that Republicans have moved twice as fast to the right as Democrats have to the left. But just because the Democrats have moved more slowly, does not mean that they will not eventually arrive.

Why is this happening?

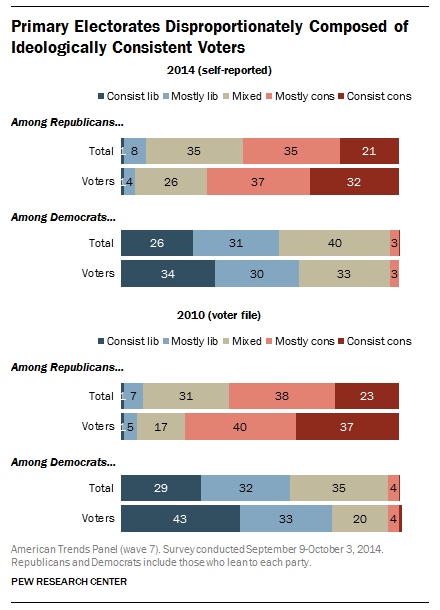
Many explanations are mooted to explain it but two factors have clearly played a major role: (1) the people who identify with each party are more ideologically homogenous, and (2) the people who vote in party primaries, and choose nominees, are more extreme than all members of their own party.

The following figure by Pew shows the composition of the primary electorates of both parties in 2010 and 2014. Among Democrats, 64% of primary voters were liberal in 2014 and 76% in 2010. Among Republicans, 69% of primary voters were conservative in 2014 and 77% in 2010.

The decline in extremism from 2010 to 2014 is illusory as the survey methods were different. Unlike in 2010, the 2014 survey utilizes self-reported voters but many survey respondents say they voted even though they did not and the non-voters are more likely to be moderates. Regardless, the primary electorates of both parties are more extreme than in past decades.

Primaries

Most representatives are from districts that are generally safe for one party or the other, so they naturally focus on the party primary–heavily skewed in one ideological direction.

But even fewer safe districts wouldn’t really undercut polarization. The ideological distribution of primary voters is such that nominees must cater to them even if winning the general election requires moderation. Marylanders should remember when liberal Del. James Hattery beat more moderate Rep. Beverly Byron in the 1992 primary. Hattery then promptly lost the seat to Roscoe Bartlett.

The same dynamics are occurring in Maryland legislative elections. The new Democratic caucuses in the General Assembly will contain more liberal and fewer moderate members than in past years. The retirees and the defeated are disproportionately among the more conservative Democrats (e.g. Dyson and James). Similarly, the Republican caucuses will also be more staunchly conservative. Republican retirees (e.g. Kittleman and Brinkley) were more moderate and willing to work with Democrats than their replacements.

Governor-Elect Hogan is going to have a difficult time navigating these political waters. In order for legislation to pass the General Assembly, it will require substantial Democratic support. However, the required compromises risk alienating conservative legislators who are opposed to arriving at accommodations with the Assembly’s liberal majorities even though it is vital to the operation of Maryland government.

The next four years will be many things but boring isn’t one of them.

Share

Charm City Senate Primaries–Challenger Favored in D44

D44New2014 Baltimore City and County District 44

Links to Part I, Part II, Part III, and Part IV of this series on top Senate primaries.

District 43 (D): Incumbent Sen. Joan Carter Conway faces Baltimore City Councilman Bill Henry, whose city council district overlaps with this legislative district. Although the likeable, smart Henry is a strong challenger, key factors render Conway the favorite, as I detailed previously in my overview of this district. Despite some bad press, Conway has far more money and has formed a tight slate with strong delegate incumbents. Rating: Likely Conway.

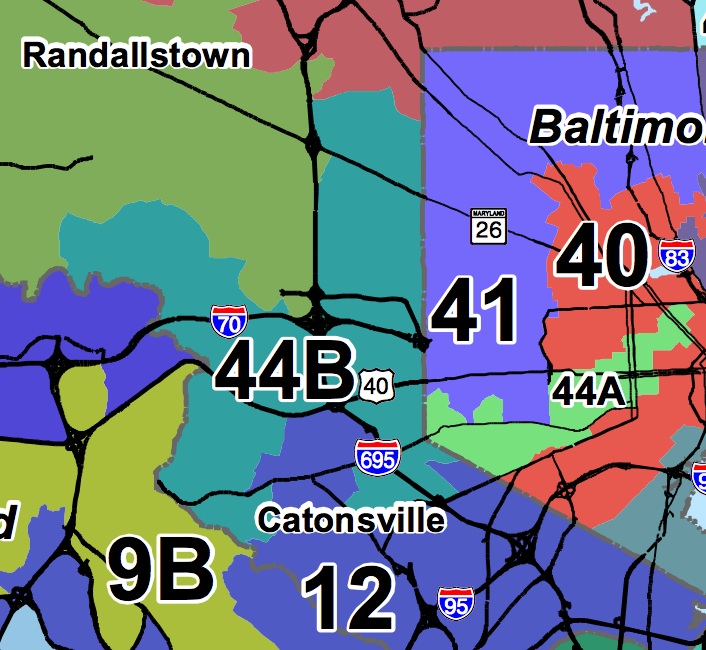
District 44 (D): As usual, Baltimore City state legislative redistricting was a game of political musical chairs. The City had to lose representation and two-thirds of District 44 has shifted out of the City into the County (see map above). County District 44B will elect two delegates to one from City District 44A.

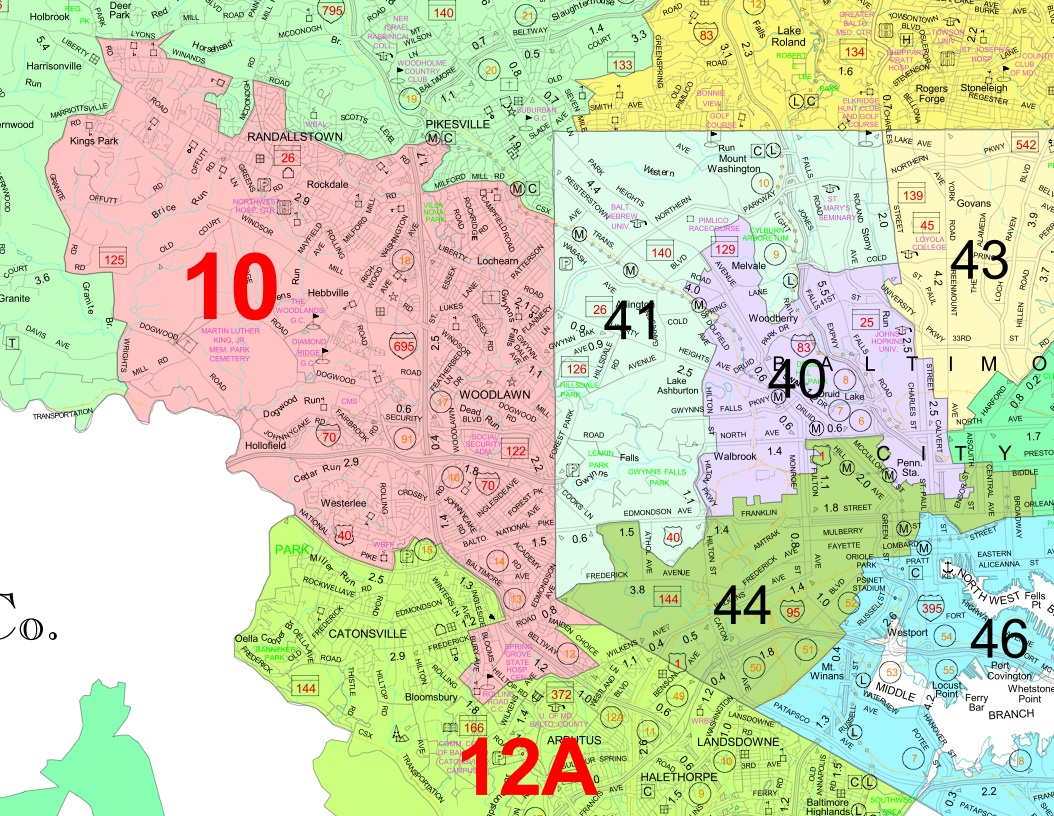
Virtually all of the new territory was formerly part of District 10 (see map below). In truth, the new District 44 is more the heir to District 10 than to District 44. The new District 10 has taken in much new territory further north in Baltimore County. No wonder Sen. Delores Kelley (D 10) joined Sen. Jim Brochin in filing an unsuccessful lawsuit against the new plan.

Redistricting has set up one of this year’s toughest Senate primaries. Del. Shirley Nathan-Pulliam (D 10), who lives in the portion of the old District 10 that is now part of the new District 44, is challenging incumbent Sen. Verna Jones-Rodwell (D 44). The new district contains roughly twice as many people from Nathan-Pulliam’s old district, though it bears Jones-Rodwell’s district number.

D10and44old2010 Baltimore City District 44 and Baltimore County District 10

Besides more past constituents, Nathan-Pulliam has more money in her campaign account–$80K to $63K for Jones-Rodwell. Neither can raise money during the session, so these are the amounts with which they will enter the final two months of the campaign.

Nathan-Pulliam has served in the House since 1995 and has been Deputy Majority Whip since 2003. Sen. Jones-Rodwell served one term in the House before winning election to the Senate in 2002 where she chairs a subcommittee of the powerful Budget and Taxation Committee.

Endorsements and slating can help either candidate. Nathan-Pulliam shows little sign of losing her base. Sen. Delores Kelly (D 10) has endorsed Nathan-Pulliam, her former delegate. Nathan-Pulliam also won the support of the 10th Democratic Club, much of which presumably now lives in District 44.

So far, I have not heard of any slates being formed (post on Facebook if you know otherwise). Nathan-Pulliam is older than Jones-Rodwell, who may find it easier to do the aggressive door knocking that she will need to do to introduce herself in Baltimore County.

Jones-Rodwell has fewer former constituents and less money than her opponent. Races like these often turn out to be friends-and-neighbors contests, especially when they straddle jurisdictional boundaries like District 44, so the incumbent is in real trouble. This is the first district I’m rating as favoring the challenger. Rating: Lean Nathan-Pulliam.

Share