Tag Archives: turnout

Diving Into Virginia Results Reveals Depth of Republican Woes

Examining data more closely suggests strongly that Democrats were more energized than Republicans in 2017. The above graph shows changes in turnout from 2016 to 2017 as it relates to the share of a county or independent city that voted for Democratic Ralph Northam as a share of the two-party vote. In general, the more a place voted for Northam, the smaller the decline in turnout from the presidential election.

Analysis of the Virginia results does not suggest a bright future for Republicans. Democrats are doing well in fast-growing places and Republicans in shrinking places. This first map shows which counties are growing fastest.

Source: Cooper Center.

Suburban areas continue to show strong growth. In the DC suburbs, Loudoun and Prince William Counties, along with Alexandria and Arlington are on pace for greater than 10% growth.  The same is true in the Richmond, Charlottesville, and Fredericksburg areas, as well as Chesapeake and Suffolk Counties outside of Norfolk and Virginia Beach. Slow growth areas are centered in more rural Appalachian and Southside Virginia.

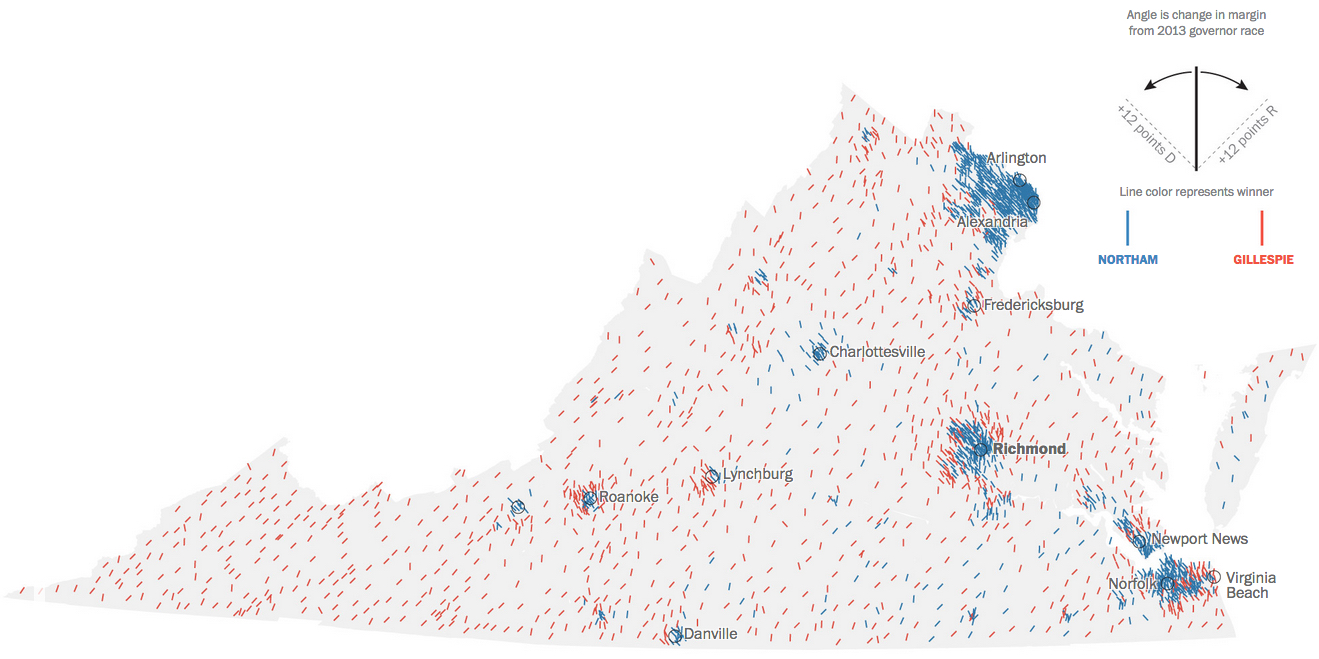
Next up, a map that shows where Northam and Gillespie each made gains relative to 2013.

Source: Washington Post.

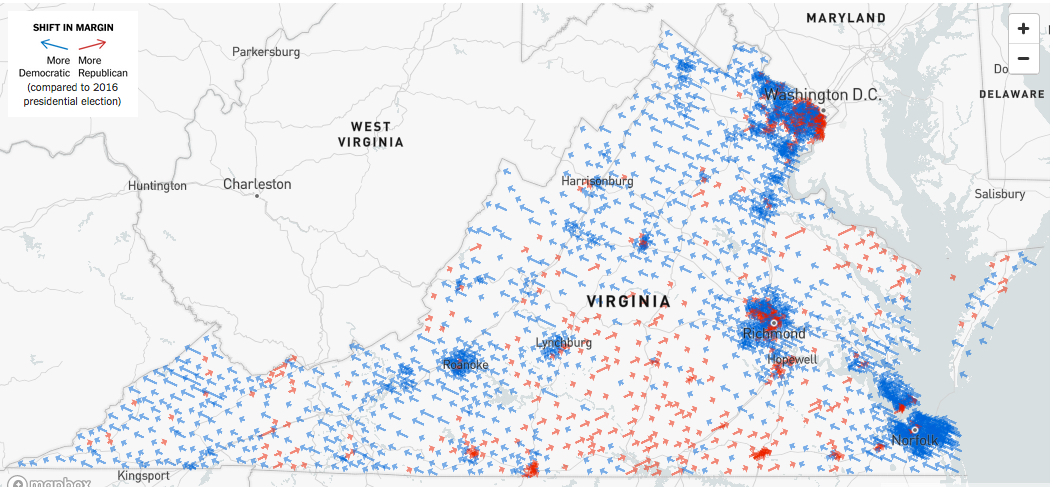
Notice that the blue is concentrated primarily in almost the exact same fast-growing areas. In contrast, places with declining industries where people leave are trending Republican. Not too surprising when one considers that the Trump coalition was based on people who fear change and look to the future with foreboding.

It is a fascinating shift, however, as Republicans used to do incredibly well in precisely the sort of exurbs that are among the fastest growing places in the state. Twenty years ago, no one would have imagined that places like Henrico (Richmond suburbs) along with Prince William and Loudoun would anchor Democratic victories. Indeed, Republicans once expected growth in these areas to carry them to power. Not any more.

The shifts are even more dismal if one compares 2017 to the presidential election:

Source: New York Times.


Share

Maryland Democrats’ White Problem

In the above table, I’ve collected exit polls from past presidential, senatorial, and gubernatorial elections in Maryland. If exit polls were unavailable, I used pre-election surveys.

Mac Mathias was the last Republican to win a U.S. Senate race in Maryland in 1980. No Republican presidential candidate has carried Maryland since George H.W. Bush in 1988. On the other hand, Republicans managed to win the governor’s mansion twice since 2000. Bob Ehrlich’s 2002 victory broke the long Democratic streak since Spiro Agnew’s fluke election in 1966.

No Democratic winner fell below the 39% gained by Ben Cardin in his successful 2012 reelection bid. In both gubernatorial elections won by Republicans, the Democratic share of the white vote fell dramatically. In 2002, Kathleen Kennedy Townsend won an estimated 34% of white voters.

Anthony Brown performed even more poorly with just 31% in 2014. Towards the close of the 2014 campaign, I estimated that Brown realistically needed a maximum of 37% white support in order to capture the governor’s office.

Lower levels of white support result from two factors: defection and abstention. Put another way, some normally Democratic white voters switched to the Republican in these races. Additionally, others either didn’t vote or sat out these contests.

Since the 2016 election, much of the discussion has focused on the need to increase Democratic turnout, especially non-white turnout and especially in midterm elections. For Democrats, these are good goals, if only because the share of the white vote needed to win declines if more non-white, primarily African American but also Asian and Latino, Democrats vote.

At the same time, the 2016 elections also show the limits of relying solely on non-white voters. Turnout nationally among Latinos and Asians rose and by more than white turnout. African-American turnout declined from the historic levels seen when Barack Obama was at the top of the ticket.

Nevertheless, the task of winning the governor’s mansion would be a lot easier if Democrats can win back a higher share of the white vote by preventing both defections and abstentions. Even with higher minority turnout, it would have been hard for Anthony Brown to win without increasing white support.

The implications extend beyond gubernatorial elections. The retention of not so much control but dominant majorities in the General Assembly depends on receiving enough white voters. Losing more white votes means, for example, losing Senate seats that are critical to invoking cloture for legislation favored by Democrats and their ability to override Gov. Hogan’s veto.

I’m not saying that Democrats should take minority voters for granted. No political party should ever take anyone’s vote for granted, and I expect Hogan to look to increase his non-white support in 2018. But Maryland Democrats cannot repeat their 2014 hemorrhage in white support if they want to defeat Hogan.

Share

CD4 Target Demographics

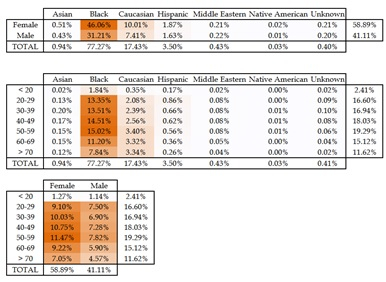
Today, 7S looks at the likely demographic composition of the electorate in the Fourth Congressional District. Many thanks to my anonymous reader who has so helpfully shared these statistics with me. The first table shows the share registered Democrats in CD 4 broken down by (1) race and gender, (2) race and age cohort, and (3) gender and age cohort.

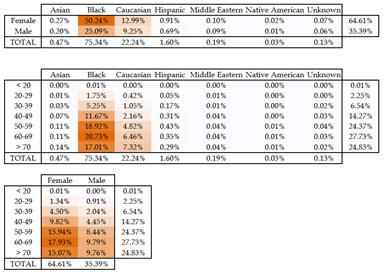
CD4 race age genderThe second table presents the same three demographic breakdowns but for voters who participated in two of the last four Democratic primaries. Close examination of the data reveals key differences between the makeup of the potential electorate of registered Democrats and likely voters, defined here as those who have voted in two of the last four primaries.

CD4 race age gender 2 of 4

Race and Ethnicity

First, African Americans will form an overwhelming share of the electorate as they comprise 77.3% of registered Democrats and 75.3% of likely voters.

Latino form 3.5% of registered Democrats but this growing demographic punches below its weight, as Latinos composed just 1.6% of likely voters. However, Latino voter turnout has been steadily increasing, so the turnout over the past four primaries may well underestimate the share of Latinos who will vote in the 2016 Democratic primary.

In contrast, Whites, listed in the table as Caucasians, vote a high rates. They form 17.4% of registered Democrats but 22.2% of likely Democratic primary voters. So far, all of the candidates who are still in the mix for the race are African American. An ability to attract white voters will aid a candidate’s campaign greatly.

Voters would do well to remember that Rep. Al Wynn won this seat originally through his biracial appeal. He came in second in both Prince George’s and Montgomery but defeated a black candidate with support centered in Prince George’s and a white candidate with support primarily in Montgomery.

Similarly, support from whites and Latinos in Montgomery played a critical role in Rep. Donna Edwards’ successful primary challenge to Rep. Al Wynn. In short, candidates who can combine significant black and white support tend to be formidable.

Gender

Women are an impressive 58.9% of registered Democrats but an astounding 64.6% of primary voters. At nearly two-thirds of likely voters, expect candidates to spend a lot of time at events that attract especially high numbers of women.

Candidates will also work hard to identify concerns that can attract a disproportionate share of their votes. No group or gender is monolithic in its voting behavior but some issues resonate with greater effect with women than men.

Race, Gender, and Age

Older voters participate at much higher rates than younger voters in Democratic primaries. Consider than 26.7% of registered Democrats but 52.6% of likely voters are over age 60. If voters wonder why they hear candidates talk a lot more about social security and health care than education, now they know.

African Americans over 60 form 37.7% of the electorate. African Americans over 50 are 56.7% of the electorate. Black women compose the bulk of these voters because (1) women register disproportionately as Democrats, and (2) the gender breakdown of population skews more female among older people.

In the overall population aged 20 to 60, there are roughly 1.03 women for every man among the civilian non-institutionalized population. Those numbers rise dramatically for older people. There are 1.22 women for each man in the over 60 population. That ratio rises to 1.26 for the over 65s and 1.35 for the over 70s.

Older people, especially older women, will play a disproportionate role among white voters too. Likely voters aged 60 and older form 62.0% of white voters. Again, expect these voters to be disproportionately female.

Key Demographics

Likely voters tend to be Black, older, and female. While every individual voter counts and matters, older Black women will be the central force in the Democratic primary for CD 4.

Whites, particularly older White women, can potentially play a pivotal role, as they form over one-fifth of likely voters. Expect all candidates to court this group. Black voters often play a similar role in Democratic primaries in white majority areas.

Share

CD8: Where are the Voters?

Building on Adam Pagnucco’s analysis from yesterday, I thought it would be great to delve into voter turnout in past Democratic primaries within the Eighth Congressional District. My gratitude to the reader who provided me with this extremely interesting registration and turnout data.

Registered Democrats by State Legislative District

So where do registered Democrats live and which ones are more likely to vote? The first table shows the current number of registered Democrats along with past primary turnout broken down by state legislative district. Note that the data include only the portion of state legislative districts within CD 8.

TO1 Past VH x SHD

D16 holds 19.8% of registered Democrats and an even higher share of actual voters. In Democratic primaries from 2008 through 2014, D16 residents formed at least 21.0% and as much as 22.2% of voters. D16 is the most highly educated district in Maryland–and quite possibly the country–and studies show that education is more strongly related to voter turnout than any other factor. These numbers should encourage Del. Ariana Kelly.

In contrast, these numbers are less favorable to Sen. Jamie Raskin (D-20). Though D20 is chock-a-block with registered Democrats, not all of D20 is in CD8. As a result, D20 is home to just 16.9% of registered Democrats in the Eighth, probably less than many expect though still high.

Moreover, turnout within the D20 portions of CD8 is erratic. In 2014, D20 Democrats voted at a relatively high rate in the primary and constituted 17.6% of CD 8 Democratic primary voters. But their share in the district never exceeded 15.8% in the Democratic party primaries held from 2008 through 2012.

The second biggest stronghold of potential Democratic primary voters in CD 8 is D18, as it is home to 18.8% of all of registered Democrats. Turnout effects are smaller than in D16 or D20 with the share of D18 Democrats among all of the Eighth’s primary voters ranging from just 18.2% to 19.6%.

Del. Kumar Barve (D-17) suffers not only from the split in his district between the Sixth and Eighth Congressional Districts but the relative paucity of Democrats. Barve currently represents just 8.5% of the Eighth’s registered Democrats. They also tend to under perform on primary day, as their share of CD 8 voters ranged from 7.7% to 8.2% in the past four Democratic primaries.

Finally, it is worth noting that 17.9% of registered Democrats living in the Eighth don’t live in Montgomery County, so candidates will want to spend time and advertise in these areas. Fortunately for candidates, only around 8% of registered Democrats live in Carroll County, located in the Baltimore media market.

The rest live in the very expensive Washington media market where the vast majority of viewers are not registered Democrats living in the Eighth District. Less pricey social media will be extremely popular this year. But candidates cannot forget traditional media, as the primary electorate skews very old.

Registered Democrats by State Legislative and County Council Districts

The second table breaks down the share of registered Democrats by state legislative district and county council district:

TO2 Dem RV x SHD x County Council

Montgomery Councilmember Roger Berliner (D-1) represents 26.9% of CD 8’s Democrats but he has declined to enter the race. However, Montgomery County District 5 holds 22.5% of registered Democrats in the Eighth–a higher share than any state legislative district. Rumored congressional candidate and former Councilmember Valerie Ervin represented a slightly differently configured version of District 5.

At-Large Montgomery Councilmember Nancy Floreen has publicly mused about a run for Congress. She represents 81.8% of registered Democrats in CD 8, an overlap that any other of the rumored candidates would envy. But, as Adam pointed out, she has only run in the multimember at-large district, so the congressional race would be a different. Nevertheless, Floreen likely starts with higher name recognition than other candidates.

Likely Voters by State Legislative and County Council Districts

The final table breaks down the share of Democrats who voted in at least two of the past four primaries by state legislative district and county council district:

TO3 Dem 2 of 4 x SHD x County Council

Interestingly, this table reveals that D16 holds more people who are likely to vote in the primary than Council District 5. The high rates of turnout among D16 residents would bring Del. Kelly to parity with former Councilmember Ervin in terms of likely voters previously represented even though Ervin represented far more people.

Turnout only accentuates the Montgomery tilt of CD 8, as it is home to 82.5% of people who voted in at least one-half of the past four primaries. Among the remainder, 10.1% live in Frederick County as compared to 7.4% in Carroll County.

Based on this table, the most desirable pieces of real estate to have represented before in terms of Democratic primary turnout are:

1. Montgomery County (Floreen)
2. Montgomery County Council District 1
3. State Legislative District 16 (Kelly)
4. Montgomery County Council District 5 (Ervin)
5. State Legislative District 18
6. Montgomery County Council District 4
7. State Legislative District 20 (Raskin)
8. Montgomery County Council District 3
9. State Legislative District 19
10. Frederick County
11. State Legislative District 4
12. State Legislative District 17 (Barve)

Still, as Adam points out, all candidates have a lot of work to do to get known to most voters. Floreen and Kelly, who represent the most voters, have run only in multi-candidate contests. Other candidates have good bases but have run only in lower visibility races and in a portion of CD 8.

The keys to a good campaign remain the same: message, money, volunteers, and organization. Candidates need to have a message to sell to voters. They need money to pay for media to get it across and volunteers to spread the word and help canvass. But none of it matters if the candidate cannot run a a good strategic campaign.

Share

CD8 is Wide Open

Today, I am pleased to present a guest post from Adam Pagnucco:

Long-time District 8 Congressman Chris Van Hollen is now running for the U.S. Senate. Who will succeed him? No one knows because this race is wide open. That’s right, wide open.

Announced or potential candidates include At-Large Councilmembers Nancy Floreen and Hans Riemer, District 20 State Senator Jamie Raskin, District 17 Delegate Kumar Barve, District 16 Delegate Ariana Kelly, former District 5 County Council Member Valerie Ervin, former District 20 Delegate candidate Will Jawando and former WJLA anchor and current Marriott executive Kathleen Matthews. All except Matthews have campaign records. None have run campaigns that approach anything close to the scale of a congressional race.

Consider the following data.
CD8 Comparison

Campaign Spending

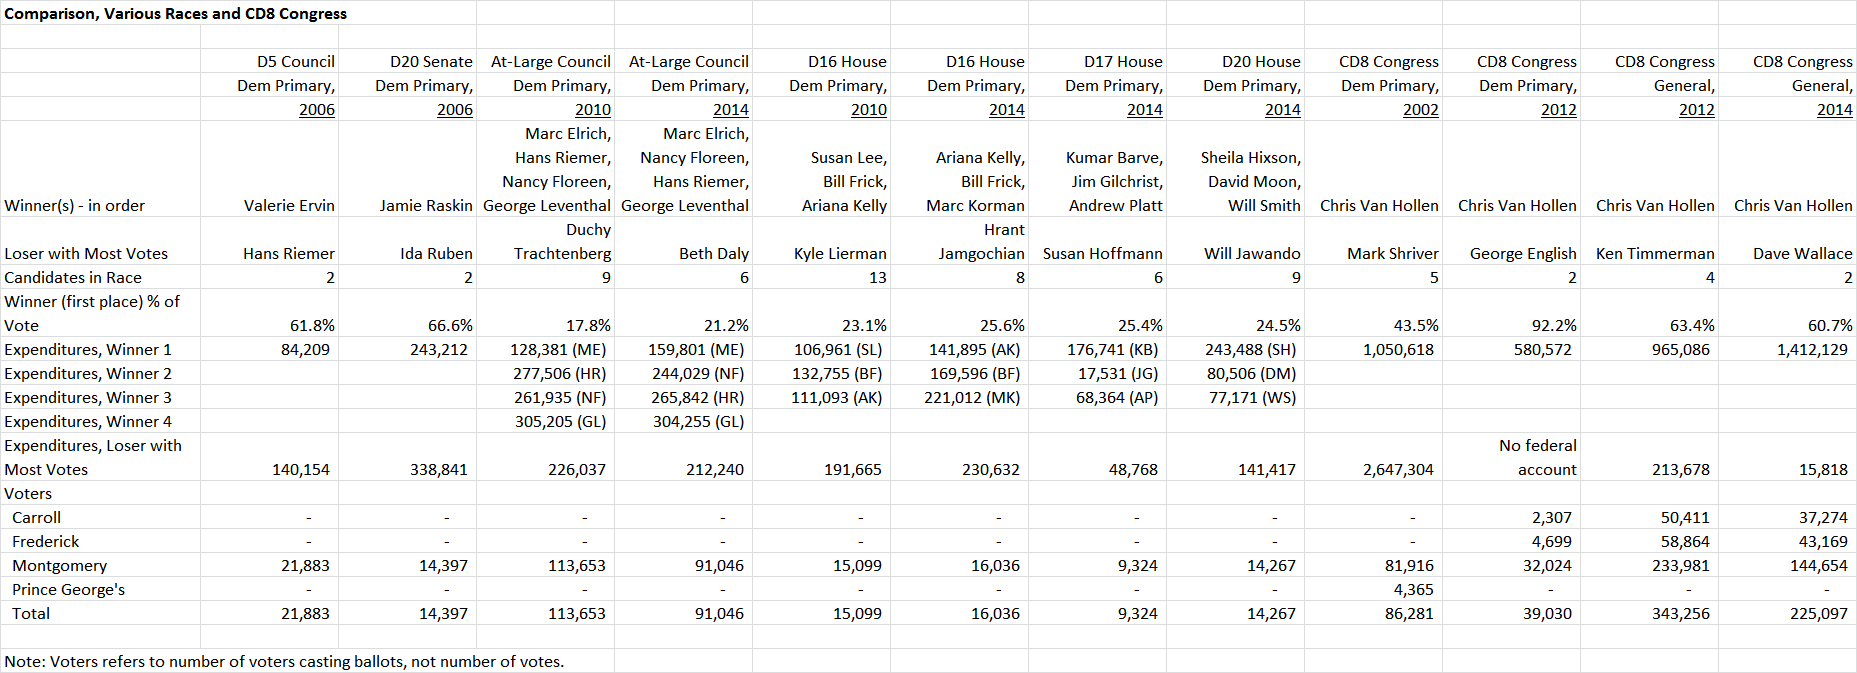
In the CD8 2002 primary, Chris Van Hollen spent $1.1 million and won. Mark Shriver spent $2.6 million and lost. None of the prospective candidates in the current CD8 have demonstrated that kind of monetary capacity. Raskin, Riemer and Floreen spent between 200k and 300k on their competitive races. Barve came close to that level in 2014. Ervin has never spent more than 100k in a campaign. All of these candidates would need to dramatically increase their fundraising activity and it’s hard to see that any one has a significant advantage over the others. Matthews, who may be able to draw on self-financing, national Dem money and corporate money, may be an exception.

Size of Electorate

It’s tricky to forecast the size of the CD8 Dem primary electorate because the district was changed radically in 2012 and it does not have a recent experience of primary competition. Van Hollen faced no-names in both the 2012 and 2014 primary and general elections. In the 2002 primary, when the district was almost entirely in MoCo, 86,000 Dems voted. That was a high turnout year for Dems in terms of gubernatorial elections, but 2016 is a presidential year and many more Dems could turn out. In 2012, a presidential year, just 39,000 Dems voted in the primary, as Van Hollen clobbered an opponent without a federal account and there was no meaningful competition in the Presidential and U.S. Senate races. A combination of competition in the U.S. Senate and CD8 races, plus support for Hillary Clinton, could drive turnout in the 2016 CD8 Dem primary north of 100,000.

Among the possible candidates in the CD8 primary, only Nancy Floreen and Hans Riemer have experience running in an electorate that large. State legislative races tend to draw out 7,000-16,000 Democratic primary voters. But Floreen and Riemer don’t necessarily have an advantage because their races are fundamentally different from congressional contests (more below).

Multiple-Vote vs One-Vote Races

A congressional race has one similarity to a State Senate race: voters only get to vote for one candidate. In House of Delegates races (at least in MoCo), voters can vote for up to three candidates. In Council At-Large races, they can vote for up to four. These are very different dynamics.

In a multiple-vote race, a candidate can be no one’s first choice, but can be the second or third choice of a lot of people and still win. Such a candidate would do poorly in a one-vote race like Congress. Even though Floreen and Riemer have won countywide, many of their voters are not voting for them. In 2010, 113,653 MoCo Democrats voted in the primary. Riemer received 40,493 votes (36%) and Floreen received 39,500 (35%). In 2014, 91,046 MoCo Democrats voted in the primary, which was notably less competitive than it was in 2010. Riemer received 49,932 votes (55%) and Floreen received 52,924 votes (58%). The number of voters who would rate either Riemer or Floreen as their first choice would be FAR fewer and would be closer to the total of one of the State Senators.

For what it’s worth, Floreen finished first in 32 of the 138 CD8 precincts located in Montgomery County in 2014. Riemer finished first in 11. At-Large Council Member Marc Elrich, who finished first in 90 CD8 precincts, has shown no interest in a Congressional race.

Delegates have similar problems. Barve and Kelly finished first in their respective House races, but the number of their voters who would have picked them as a first choice is unknowable short of a contemporaneous poll.

District Overlap

State legislators do not enter this race on equal footing. District boundaries and voting patterns give some an advantage over others. Delegate Ariana Kelly benefits from the fact that her district has more actual primary voters in CD8 than any other MoCo state legislative district. In terms of cards cast on 2014 primary election day by residents of CD8, Kelly’s District 16 led with 14,114, followed by District 18 (12, 072), District 20, home of Senator Jamie Raskin and Will Jawando (9,331), District 19 (6,948), District 17, home of Delegate Kumar Barve (4,929), District 14 (3,302) and District 15 (442). Barve is handicapped by the fact that 42% of voters in his district reside in CD6, not CD8.

Women

Fifty-nine percent of MoCo Democrats are women. That figure applies to registered Dems, voting Dems and “super-Dems,” or Dems who always vote. This is not necessarily a prohibitive advantage for female candidates. But if one or two strong women face off against a male-dominated field, it’s possible that this factor could act as something like a tiebreaker. A savvy female candidate might point out that with U.S. Senator Barbara Mikulski’s retirement and Rep. Donna Edwards’ entry into the Senate race, the state could be facing the very real prospect of an all-male congressional delegation.

Presidential Year vs. Gubernatorial Year Turnout

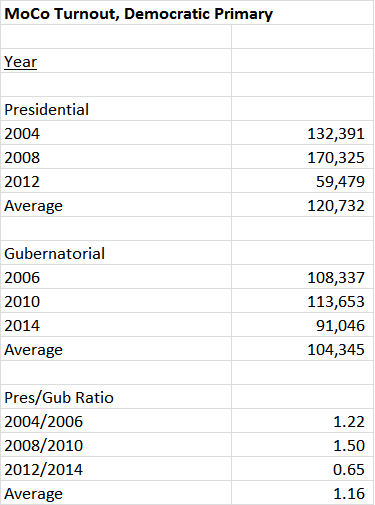
Presidential year Democratic primaries tend to attract higher turnout than gubernatorial year Dem primaries. Below are stats on how many MoCo Dems voted in the primary over the last six elections (both presidential and gubernatorial). With the glaring exception of 2012, when there was little or no competition in the presidential, U.S. Senate and CD8 races, presidential year turnouts tend to be higher. That means in a presidential year CD8 race, there will be tens of thousands of Democratic voters who have not voted in gubernatorial races and do not know their state senators, delegates or councilmembers. Communicating with these people will be a significant challenge for any candidate. Also, anywhere from a sixth to a fifth of the CD8 primary electorate will be residents of Carroll and Frederick Counties.
MoCo Turnout Dem Primary

Bottom Line

There are no favorites in this field. No candidate has proven that he or she can raise the money for a congressional campaign. The at-large County Council candidates run across a big geography but not in one-vote races. State legislators have small districts (at least compared to CD8) and delegates run in multiple-vote elections. Tens of thousands of non-gubernatorial and non-MoCo voters will have no idea who any of the candidates are and they will need some attention.

Wide open, folks. This contest is wide open.

Share

Huge Turnout Disparities in DC Helped Bowser Defeat Gray

DC used to be part of Maryland, so 7S is straying south of Western and Eastern Aves. in this late night post. The final numbers aren’t in but Muriel Bowser looks to have handily defeated incumbent Mayor Vincent Gray by 44%-33% with 127 of 143 precincts reporting.

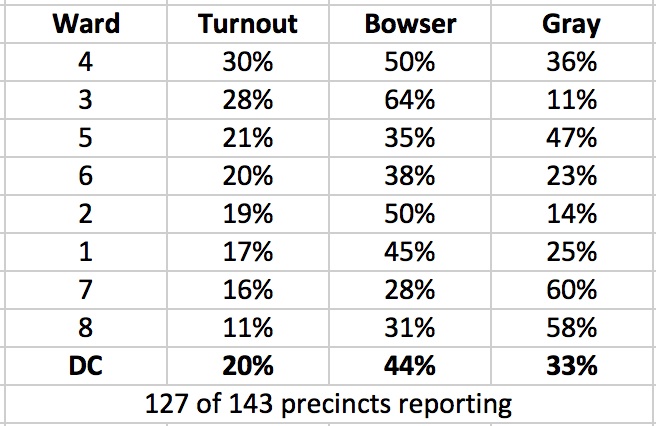
If the turnout had been more equal across wards, it might’ve been much closer. Here are the vote percentages organized by turnout:

DCElection

The correlation between vote for Bowser and turnout was a 0.74, though that could change with complete results.

Nonetheless, it seems clear that enthusiasm was way down in Gray’s Anacostia base of Wards 7 and 8 with turnout rates roughly one-third to one-half of that in Wards in 3 and 4–Bowser’s two best wards. Bowser’s field operation clearly did a good job of getting voters out in her home turf of Ward 4.

The bottom fell out for the Gray campaign in Ward 3 (Upper NW), the whitest ward in the city, where he garnered just 11%–barely ahead of Tommy Wells. He fared almost as poorly in Ward 2 (Georgetown) with just 14%.

Bowser did comparatively well in Gray’s Anacostia base of Wards 7 and 8 with 28% and 30% of the vote, respectively. She clearly consolidated the vote dissatisfied by Gray. The election map resembles that of four years ago with the critical differences of much lower turnout and a different winner.

Oddly enough, my impression is that Bowser’s voters are more satisfied with DC and its government than Gray’s, which seemingly makes no sense. Except that the allegations of corruption against Gray rendered him unacceptable to many, especially whites who did not support him four years ago, and were hammered home by the Washington Post.

On the other side, Gray’s voters were not as antagonized by Bowser as by Fenty four years ago. Additionally, many of his core supporters still feel left behind with some viewing the rapid neighborhood change or gentrification welcomed by many of Bowser’s supporters with concern.

I’ve heard heavily contrasting views on the both of these candidates with some calling Gray a fundamentally decent man who has done a fine job running the city and others declaring his corruption disqualifying and saying that DC doesn’t need another mayor indicted while in office. At the same time, some label Bowser a lightweight while others look to her with hope.

Now seems a moment not just to congratulate Muriel Bowser on a much more solid victory than many anticipated but also to thank Mayor Vincent Gray for his service. Whatever his campaign may have done, Gray does not seem to have benefited personally and he cares deeply about DC.

Share