The votes are still being counted in Maryland and across the country. While Trump has clearly won the Electoral College, whether he will carry the popular vote remains in doubt. In the meantime, let’s look at preliminary results in Maryland after last night’s political earthquake.
Though the earth didn’t move nearly as much in Maryland as elsewhere, there were significant changes in support patterns, which Clinton carried easily as expected. Here are the 2016 preliminary and 2012 final percentages side-by-side:
 As you can see the preliminary results, suggest that both candidates lost ground in Maryland. In order to more easily examine shifts across the state, I’ve created a table showing vote shifts by county with counties reordered by net change.
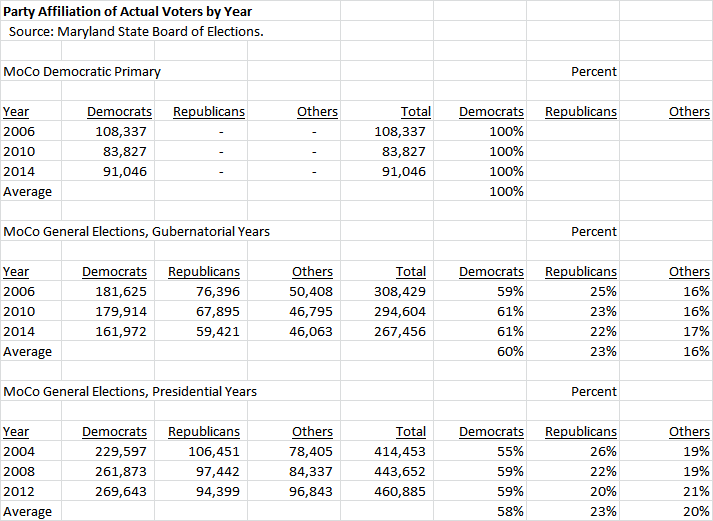
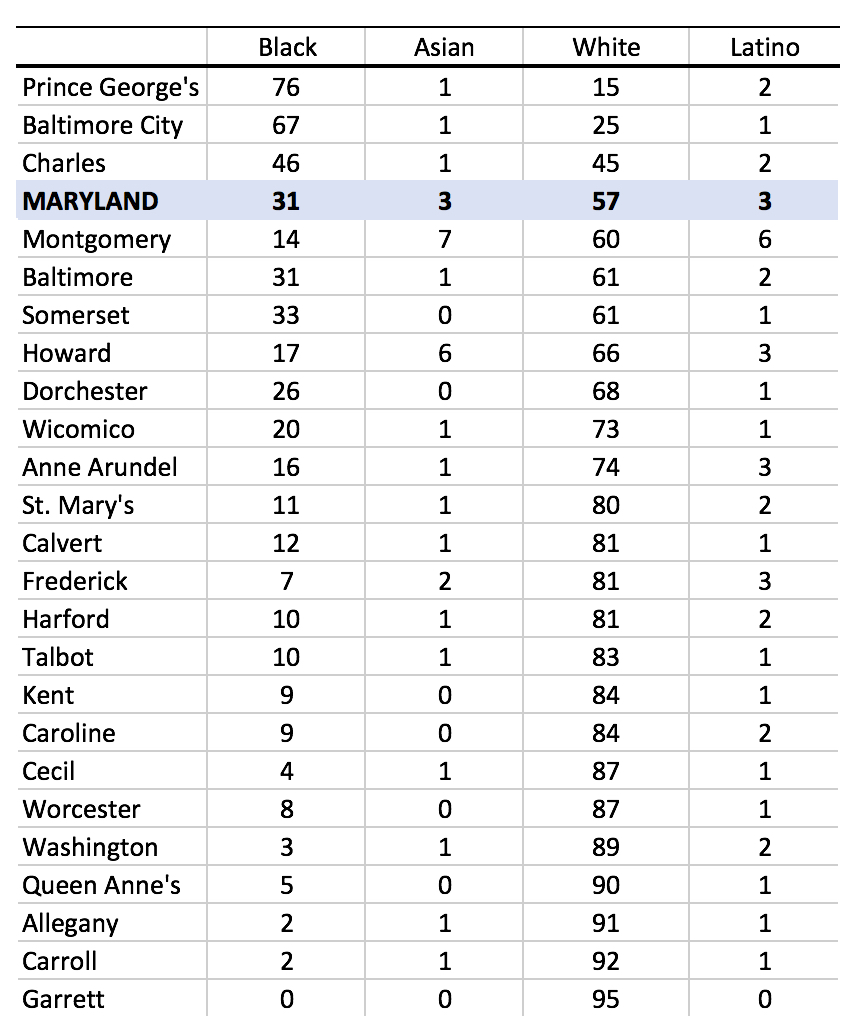
As you can see, Maryland shifted about a net 1.4% to Trump but that masks major differences across the State. The two counties with the most wealthy, well-educated, liberal white populations–Howard and Montgomery–shifted heavily to Clinton.
In these two counties, the Democrats had stunning net gains of over 10% of the vote, as Clinton gained 3% or more and Trump lost more than 7% in both Howard and Montgomery. Howard went 2-1 and Montgomery 3-1 for Clinton.
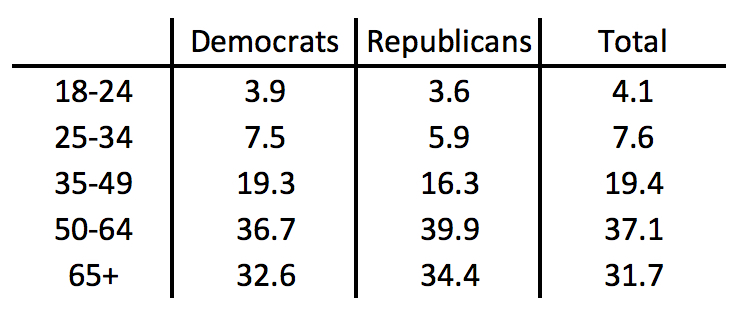
Another set of counties reveals the opposite pattern. In 14 counties, Clinton lost ground over Obama while Trump gained compared to Romney. Among the 14 counties, 11 have median incomes below the Maryland average–Calvert, St. Mary’s and Queen Anne’s are the exceptions, though none has a median income higher than Howard or Montgomery.
In addition to a tendency toward lower incomes, these areas tend to have fewer college-educated whites and be socially more conservative than Howard or Montgomery. Perhaps critically, pro-Trump counties tend to be far more suspicious of immigrants based on how they voted in the 2012 referendum.
The lowest rates of change were in the State’s two majority black jurisdictions of Baltimore City and Prince George’s, as well as more moderate jurisdictions like Frederick and Anne Arundel that tend to be closely divided between the two parties.
Overall, the key takeaway is greater geographic polarization between the Democratic and Republican areas of the State. In general, the areas that lean the most Democratic became more Democratic or stayed much the same. On the side, areas that already listed heavily Republican became more so.


