Category Archives: Minority Representation

Eight White Majority Districts Elected Black Members of Congress. That’s a Breakthrough

Read my piece in the Washington Post’s Monkey Cage blog:

This year, Americans appear to have elected a record 53 African Americans to the House.

Forty-four were reelected. Of those, four-fifths won reelection from majority-minority districts — defined here as districts where non-Hispanic whites form a minority of the voting-age population according to the 2010 Census. That’s what we’ve seen in the past: Historically, black representatives have been elected from majority-minority districts.

But here’s the big news: Eight of the nine newly elected African Americans won in districts dominated by non-Hispanic whites.

Read the full piece online over at the Post.

Share

New Minority Members of the U.S. House

I’m trying to compile a list of new African-American, Latino, Asian American and Native American Members of Congress. Additionally, I am attempting to identify the ethnicity/country of origin for Latinos and Asian Americans.

I’m concerned that I may have missed someone and am missing a few ethnicities. Any corrections or additions would be welcome

Latinos
Jesus “Chuy” Garcia (IL 4), Mexican
Alexandria Ocasio-Cortez (NY 14), Puerto Rican
Xochitl Torres Small (NM 2), Mexican
Antonio Delgado (NY 19), ? (and African American)
Anthony Gonzalez (OH 16), Mexican
Veronica Escobar (TX 16), Mexican
Sylvia Garcia (TX 29), Mexican

African Americans
Jahana Hayes (CT 5)
Lucy McBath (GA 6)
Lauren Underwood (IL 14)
Ilhan Omar (MN 5)
Ayanna Pressley (MA 7)
Steven Horsford (NV 4) returning after gap in service
Antonio Delgado (NY 19)
Colin Allread (TX 32)

Asian Americans
Young Kim (CA 39), Korean
Donna Shalala (FL 27), Lebanese
Rashida Tlaib (MI 13), Palestinian
Andy Kim (NJ 3), Korean
Michael San Nicolas (GU Delegate), Chamorro

Native Americans
Sharice Davids (KS 3), Ho-Chunk tribe
Deb Haaland (NM 1), Laguna Pueblo

Share

Black Representation in Municipalities II

muni1

Last Thursday, I examined the relationship between the share of African Americans and the share of black elected officials (BEOs) in Maryland’s 35 most populous municipalities. While there is a clear and strong overall relationship, which municipalities have the largest gap between the share of African Americans in the population and on the council?

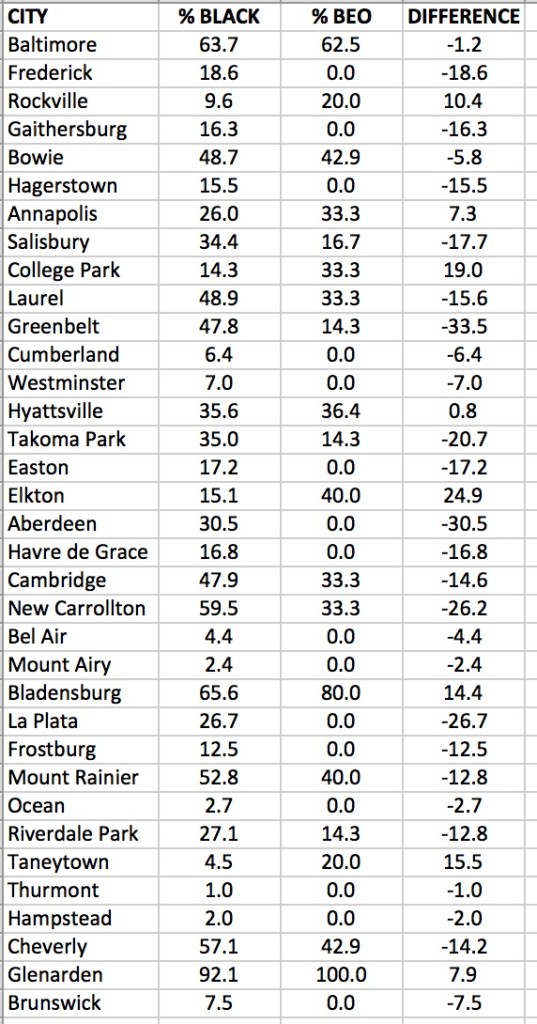
The table at the top of the post is organized in descending population order; it shows the share of BEOs, including the mayor, in each municipality and compares it to the share of blacks. Baltimore–Maryland’s largest municipality by far and really more comparable to a county–shows an unusually tight link, facilitated in part by the large size of the Baltimore City Council compared to those of Maryland’s other municipalities.

Most Maryland municipalities have councils with just five members, which can explain the gap in many cases. Since councilmembers only come in whole numbers, towns that are 30% black will have a -10% gap if there is only one black councilmember but a +10% gap if there are two black councilmembers.

The following table sorts the 35 municipalities by the difference between the percentage of BEOs and African Americans in the population. Despite the strong overall relationship, the difference within individual cities and towns varies dramatically–from around +25% in Elkton to -33% in Greenbelt.

muni2

Elkton, the county seat of Cecil County, tops the chart as two of its four councilmembers are black (the mayor is white) but the town is just 15% black. College Park scores next highest with three black councilmembers out of eight total (the mayor is white), though the city is just 14% black.

Taneytown in Carroll County is less than 5% black but has elected one black councilmember. Blacks in Bladensberg may benefit from their majority status to elect a disproportionate share of councilmembers. Rockville, Maryland’s third largest municipality, has elected one black councilmember, though the city is just 10% African American.

On the bottom is Greenbelt, which is nearly one-half black, but has just one black councilmember out of seven total. Perhaps even more strikingly, two of New Carrollton’s five councilmembers are black (the mayor is white), though the municipality is 60% black. Aberdeen and La Plata–both in counties that have experienced rapid growth over the last few decades–have sizable black populations but no African-American members of their councils.

Famously left-wing Takoma Park has just one recently elected African American on its City Council out of six members (and also has a white mayor). African Americans form 35% of the Takoma Park’s population. So much for stereotypes.

Of course, none of this explains why some towns have a relatively or low or high share of BEOs–a topic perhaps for a future post. And one must also note that black councilmembers are not the same as black representation. People can be well represented by people from a different background. At the same time, one expects to a diverse range of officials in diverse towns.

[Note: Salisbury ranks low in the table but is set to have a second councilmember elected from a black-majority district starting with the 2015 elections, as noted in a previous post.]

Share

Black Representation in Municipalities

Scatter1

The Michael Brown shooting in Ferguson, Missouri has attracted attention to African-American representation in municipalities. Blacks are underrepresented on the police force, comprising just three of the city’s 53 officers.

Additionally, only one of Ferguson’s six councilmembers is African American in a city that is now 67% black. Over at the Monkey Cage, Brian Schaffner, have done an excellent job of explaining the political dynamics underlying this disparity. Essentially, the electorate in the off-year municipal election is much more white than in presidential elections.

So how does Maryland do?

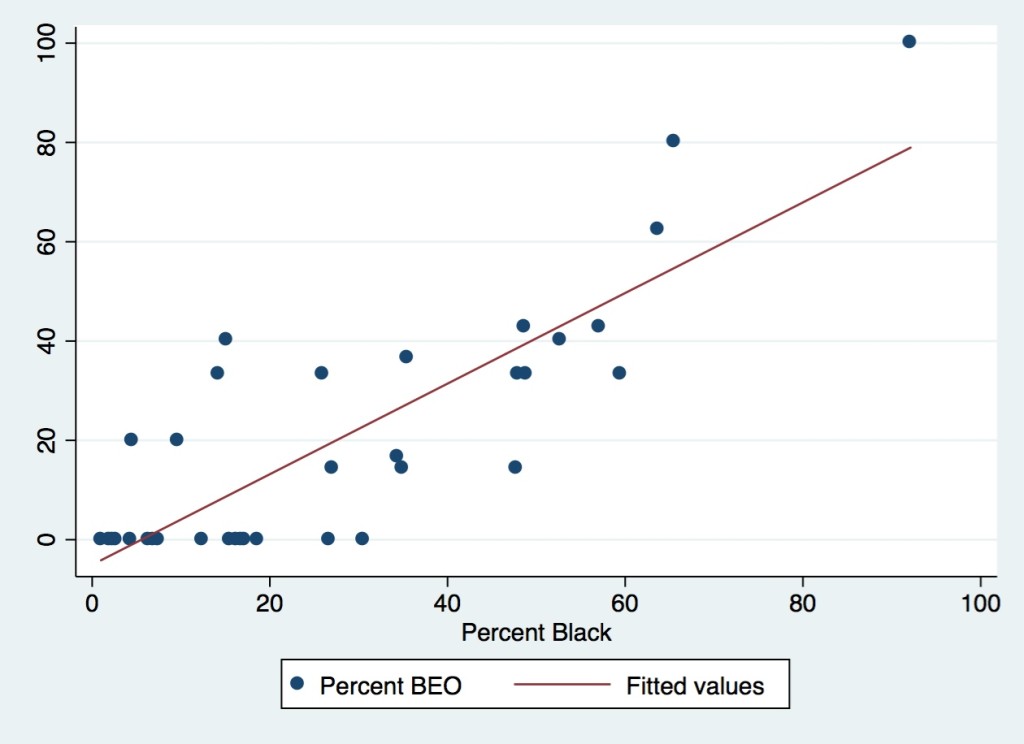
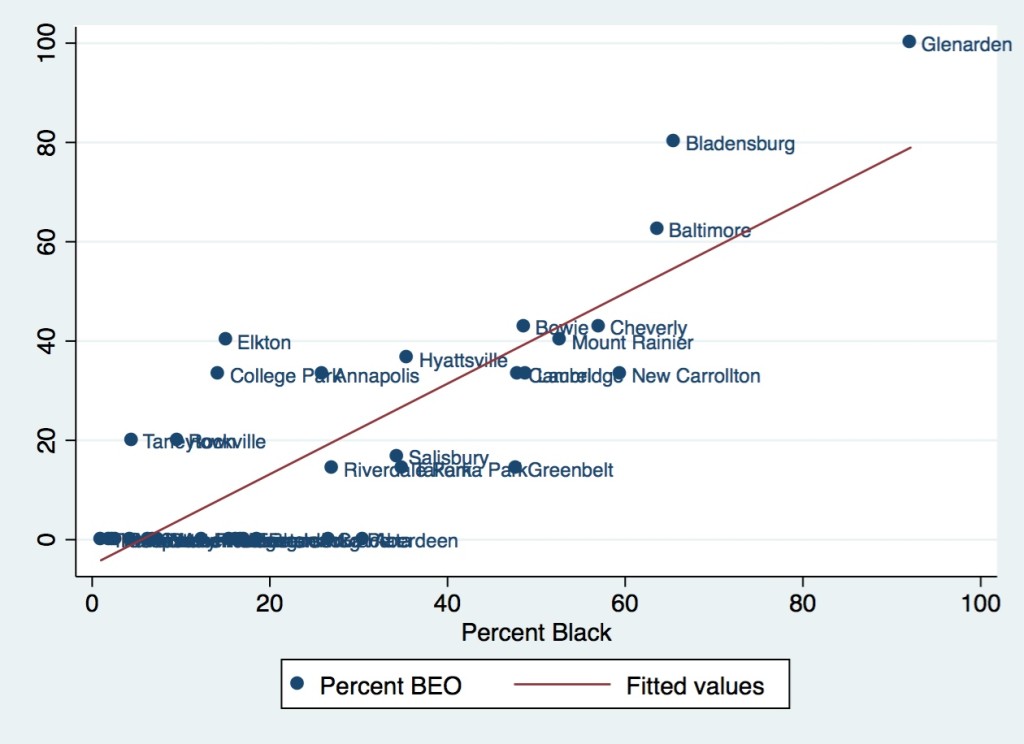
Presented here are two graphs of the percentage of Black Elected Officials (BEOs) against the percentage of Blacks in the 35 largest municipalities in Maryland. The share of BEOs is measured out of the total number of councilmembers plus the mayor–if there is one. The graph at the top of the post shows each city as a dot while the graph below replaces the dots with city names.

The line in each graph reveals the predicted relationship between percentage black and percentage of BEOs according to linear regression. (The short, short course on linear regression: the line is the one the minimizes the sum of the squared vertical distance between the dots and the line.)

The line suggests that a 10% increase in the share of blacks results in a 9.1% increase in black representation. The total predicted share of black municipal officials is about 5% lower than the number predicted by 9.1% x Percent Black. This 5% lag is not that shocking as the share of voting-age blacks often lags behind the share of blacks in the population due to the greater share of minors in the African-American population.

scatter2

Next up: a closer look at individual municipalities.


Share

Voting Rights and Redistricting

Many people know that the Voting Rights Act can require the creation of majority-minority districts to protect minority representation. But the actual demands of the Act are often misunderstood.

The Supreme Court outlined the basics of when states must create districts designed to advance minority opportunity in a 1986 case called Thornburg v. Gingles. The case outlined a three-prong test that plaintiffs must meet in order to win a case arguing for the creation of a new majority-minority district.

Specifically, the minority group must prove that (1) it is sufficiently large and geographically compact to constitute a majority in a single-member district; (2) it is politically cohesive; and (3) racial-bloc voting usually defeats the minority’s preferred candidate.

I think of the first prong as the “is there a solution?” prong. Courts generally are not in the business of taking cases where they cannot offer relief. So if it is not possible to create a geographically compact single-member district with a group majority, don’t bother.

Of course, this still leaves room open for interpretation. For example, how compact must a district be to be deemed “geographically compact?” In more recent cases, courts have inveighed against minority districts with bizarre boundaries drawn for racial reasons–even as the Court has deemed it acceptable to gerrymander for partisan reasons.

This prong is one reason why there has been little litigation to create Asian-American majority districts. It’s just not possible to draw these districts  in most areas of the country just as it would likely be very difficult at best to create one anywhere in Maryland.

The second prong requires that the minority group tends to vote together. Obviously, 100% cohesion never actually occurs and is not needed to meet this requirement. Moreover, the level of cohesion can still vary across races.

But the basic idea is that you cannot draw a district designed to protect the interests of minority if the minority is not cohesive. For example, how would one advantage the interests of a group that splits its votes evenly between Democrats and Republicans?

The third prong is often the most critical. If the first prong focuses on the potential for a solution, this prong assesses whether there is a problem. Voting must be racially polarized–that is, the minority and majority groups must regularly, though not always, support different candidates.

Moreover, racial-bloc voting must be sufficiently great to defeat the minority’s preferred candidate. After all, if a black candidate in a 40% black district receives 85% of the black vote and 35% of the white vote, the black candidate will still win with 55%.

If the minority candidate can win without drawing a district with a majority of group members, the Court did not really see a problem. Why should courts intervene to aid minority candidates if they have a good shot even without their help?

So the racial-bloc voting has to be sufficient to defeat the minority’s preferred candidate. For example, in the same district, if the black candidates rarely received more than 10% of the white vote, they would usually lose and meet the requirement.

In cases in which minorities can win with reasonable frequency even if they do not constitute a majority, courts are more reluctant to create districts. Del. Ana Sol Gutiérrez has argued for creating a subdistrict in District 18 to elect a Latino candidate. But her repeated election from a district without a Latino majority would provide evidence for the other side in a court case.

Note that I refer to the minority’s preferred candidate. The point is the candidate preferred by the minority group regardless of the race of the candidate. So white candidates who receive a majority of the black vote running against a black candidate are still minority-preferred candidates–or candidates of choice in the argot. Still, results from elections with candidates of the same race as the group at issue are considered especially valuable in assessing racial polarization in voting rights cases.

One also has to be careful not to lump minority groups together willy-nilly. Courts do not just combine African Americans, Latinos, and Asian Americans into a single category. On the contrary, one would need to prove that such groups consistently vote together to  begin to make such a case. And they often don’t.

If you’d like to know more, you can buy a copy of my book, The Paradox of Representation: Racial Gerrymandering and Minority Interests in Congress, (the perfect Easter or Passover gift) or look online at Google Scholar or Research Gate for my articles in various political science and law journals.

 

Share