Category Archives: General Assembly

Changing the State Budget Process?

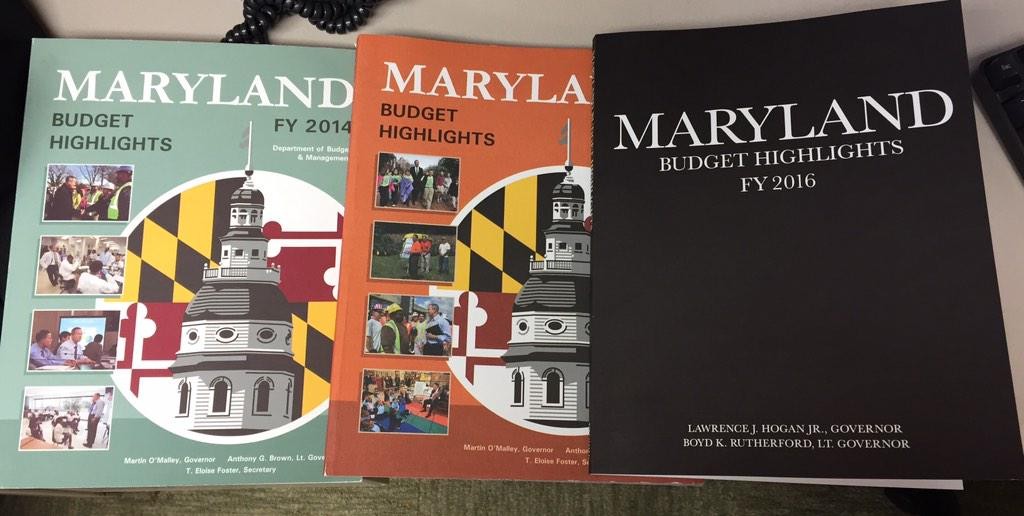
budgetbooks

Black is the New Orange: Hogan’s Budget is on the Right

Over at the Free Stater, Todd Eberly has a great post that unpacks exactly why governors of Maryland are considered the most powerful in the nation:

According to the constitution of Maryland, the Assembly cannot increase spending in the governor’s budget and it cannot move funds around in an effort to increase funding in one area by reducing it elsewhere. All the Assembly can really do is reduce the amount of spending proposed by the governor.  The Assembly can introduce legislation to provide funding for programs – but only if the legislation identifies a funding source (e.g. raising taxes). Certainly, members of the Assembly can work with Hogan and try to convince him to introduce a supplemental budget that provides more funding for programs they value, but failing that, Hogan’s budget will stand.

Senators Rich Madaleno, Guy Guzzone, and Roger Manno have introduced a constitutional amendment to give the General Assembly more power vis-a-vis the governor. As we approach the 100th anniversary of the amendment that established this system, it seems a good time revisit our choice.


Share

General Assembly Racial Breakdowns

Elected to Maryland General Assembly in 2014

2014GArace

I’m in the middle of gathering data for a study on the election of African-American and Latino legislators, so I thought I’d share the data for the new Maryland General Assembly.

The Current State of Play

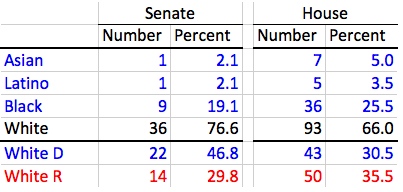
Minorities compose a greater share in the House than the Senate. While whites form three-quarters of all senators, they comprise two-thirds of all delegates. All minority groups are better represented in the House than the Senate.

Excepting the election of its only Asian member, Sen. Susan Lee (D-16), minority groups experienced more notable gains in the House, which saw its Latino and Asian membership more than double from 2010. New Asian delegates include Jay Jalisi (D-10), Clarence Lam (D-12), David Moon (D-20), and Mark Chang (D-32). David Fraser-Hidalgo (D-15), Maricé Morales (D-19), and Will Campos (D-47B) are incoming Latino delegates.

Partisan Gaps

Every single Asian, Latino, and Black member of the General Assembly is a Democrat. Whites remain split between the two caucuses. Interestingly, a majority of white delegates now sit as Republicans (50-43). Together, Asian, Latino, and Black delegates now form a majority of the Democratic House Caucus (47-43).

In the Senate, however, White Democrats form two-thirds of the Democratic Caucus and heavily outnumber White Republicans by 22 to 14. The greater preponderance of white Democrats stems partly from the greater success of Democrats in the Senate–all marginal seats are white majority districts.

The glaring gaps in the racial composition of the two parties reflects a national trend. African Americans have voted overwhelmingly Democratic since 1964. President Obama has increased the share of both Latinos and Asian Americans who vote Democratic. While his 43% of the white vote in 2008 exceeds that won by Clinton, Gore, or Kerry from 1992-2004, Obama won 39% of the white vote in 2012.

Racial gaps in voting are actually more muted in Maryland than many other places (i.e. more whites vote Democratic). In many southern states, blacks form a clear majority of a much smaller Democratic Caucus. Congress has no white members from a single state in the Deep South.

Assessing Racial Proportionality

American Community Survey Population Estimates

MDRaceThe ratio of representation to population depends on how you measure both population and race. While districts are drawn based on total population, only adult citizens can vote. In addition to the total population, the above table shows the voting-age population (VAP) and citizen voting-age population (CVAP).

On the Census form, people can now check multiple racial boxes (e.g. both White and Asian) and Latino is a separate category. The table includes only non-Latino Asians, Blacks and Whites who checked just one box in the appropriate category.

Minors comprise a higher share of the Black and Latino population than the Asian and White population, so the share of Blacks and Latinos among the VAP is lower than among the total population. Due to lower citizenship rates among Asians and Latinos, both groups comprise lower shares of CVAP than the VAP.

The net impact is that White Marylanders form 3.4% more of the CVAP than the total population. Latino Marylanders are 8.5% of the total population but just 5.7% of CVAP. Similarly, Asian Marylanders are a lower share of CVAP than the total population. The net effect for African-American Marylanders is almost a wash with a net gain of 0.6% in CVAP over the total population.

Changes Required for Racial Proportionality

No matter how you slice it, however, the share of Whites is higher than their share of the population in both the House and the Senate. African Americans, the largest minority group in the State, would need to add four senators and six delegates to their ranks to pull even with their share of Maryland’s CVAP.

However, Asians would need just one more senator to achieve CVAP parity in both houses. Latinos require one more senator and three additional delegates to draw even with Latino CVAP–a share still two-thirds of the Latino share of the total population.


Share

Regional Political Chasm Expands

maryland-county-map

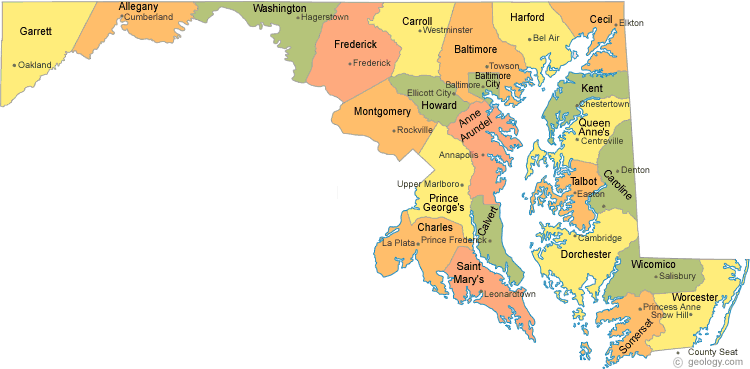
America in Miniature has very distinct political regions. I’ve divided Maryland into seven here. Republicans eliminated many of the remaining Democratic officeholders in 2014 in three rock-ribbed Republican regions–Western Maryland, Eastern Shore, and Outer Baltimore Bastions. Democrats retain iron grips on the Washington Suburbs and Baltimore City. These areas have very completely different interests and perspective on key issues facing the State.

Among the two remaining regions, Southern Maryland is really divided into two areas moving strongly in opposite directions, which just reinforces the divisions between the other regions. However, the four counties in the Swingy Outer Suburbs constitute the more marginal political territory in Maryland elections. Often up for grabs, Republicans advanced in 2014 through impressive gains in this important region.

Western Maryland

District 1 and 2 are located entirely within Garrett, Allegany, and Washington counties, and both will send entirely Republican delegations to the General Assembly. Their county commissions are also all one-party affairs. Hogan won between 75% and 80% of the vote in these three counties.

Eastern Shore

The Eastern Shore contains nine counties: Cecil, Kent, Queen Anne’s Dorchester, Caroline, Talbot, Somerset, Wicomico, and Worcester. Districts 35A, 36, 37, and 38 are located on the shore (the rest of D35 includes northern Cecil and will be discussed with Harford.) Unsurprisingly, Hogan did well here, taking between 65% and 80% of the vote in the nine Eastern Shore counties.

(Corrections made to this paragraph.) The Shore’s General Assembly delegation is heavily Republican. Majority-black District 37A’s sole delegate is the only Democratic delegate as compared to nine Republicans. Thanks to the political talent of Sen. Jim Mathias, the Democrats also hold one of the Shore’s three Senate seats. Republicans also dominate country government with 34 commission or council seats to just 11 for the Democrats.

Republicans hold all seats on the commissions or councils of Cecil, Queen Anne’s, Caroline, and Talbot Counties. They also form majorities in Wicomico and Worcester Counties. Democrats hang on to majority status by a single seat in Dorchester, Kent, and Somerset Counties–three of the Shore’s smaller counties.

Baltimore City

All six senators and sixteen delegates from the City are Republicans Democrats (Districts 40, 41, 43, 45, and 46 in their entirety as well as District 44A). The Democrats sweep city elections with similar regularity. Hogan won 22% of the vote in the City–not too bad really for a statewide Republican candidate.

Washington Suburbs

Montgomery and Prince George’s Counties are the two other large Democratic bastions. Together they contribute 16 senators and 47 delegates to the Democratic majorities in the General Assembly (Districts 14-27, 39, 47 but 27C is completely outside of Prince George’s). Democrats also easily mop up the seats on both county councils. Hogan received 37% of the vote in Montgomery but only 15% in Prince George’s.

Southern Maryland

The three counties of southern Maryland have been trending in two different directions. While growth, particularly that related to the Navy, has tilted Calvert and St. Mary’s increasingly Republican, growing African-American suburbanization has pushed Charles in the other direction.

Democrats now control the senator and three delegates from Charles (District 28) and hold all county offices. On the other hand, Republicans hold the one senator and four delegates elected entirely from St. Mary’s and Calvert (District 29 and District 27C), as well as completely dominate county offices. Hogan won 69% in Calvert and 73% in St. Mary’s. Though Hogan lost Charles, he showed surprising strength at 47% in a county that has gone for the Democrats by steadily increasing margins.

Swingy Outer Suburbs

Anne Arundel, Baltimore County, Frederick and Howard are  key pivots in state elections. All went for Hogan–52% in Howard, 59% in Baltimore County, 64% in Frederick, and 66% in Anne Arundel. All have mixed representation on their county councils with Howard heavily Democratic, Baltimore leaning Democratic, Anne Arundel leaning Republican, and Frederick heavily Republican. Republicans hold county executive seats in Anne Arundel and Howard while Democrats claim Baltimore County and Frederick.

Many of the more competitive elections for the General Assembly occur in these four counties, though there are also several solid legislative districts for each party. (Districts 3-4 in Frederick, Districts 6, 8, 10, 11, 42 and 44B in Baltimore, Districts 9, 12, 13 in Howard, District 30-33 in Anne Arundel.)

While Democrats lead 10-5 in Senate seats, they hold a smaller margin of 15-13 in House seats for these counties. Republicans picked up a several seats that Democrats had hoped to take in this region in 2014. Republicans have to continue to do well in these areas if they hope to make inroads in Maryland. All four counties have been moving towards the Democrats in presidential contests.

Outer Baltimore Bastions

Carroll and Harford Counties are Republican dream lands. Hogan was 82% in Carroll and 77% in Harford. Republicans control all county council seats in both places, as well as the executive in Harford.

Republicans now control all but one General Assembly seat, sending four senators and ten delegates to augment the GOP Caucuses. One Democratic delegate hangs on in District 34A. (District 5 is entirely within Carroll and 34 within Harford. District 7 straddles the Baltimore-Harford line but resembles Harford politically. District 35B is split between Cecil and Harford with 35A in Cecil.)

Share

Polarization Up in the Maryland General Assembly

Political scientists Boris Shor and Nolan McCarty have developed measures of state legislator ideology similar to the NOMINATE scores presented in yesterday’s post on congressional polarization. The Shor and McCarty scores are considered the best measures of state legislator ideology by political scientists and were developed through spatial modeling techniques that allow comparability both across states and years.

For individual legislators, more positive scores indicate greater conservatism while more negative scores indicate greater liberalism. The scores only range so low and high. A very rough indicator suggests that legislators with scores above 1 are especially conservative and legislators with scores below -1 are particularly liberal. Moderate legislators receive scores closer to zero.

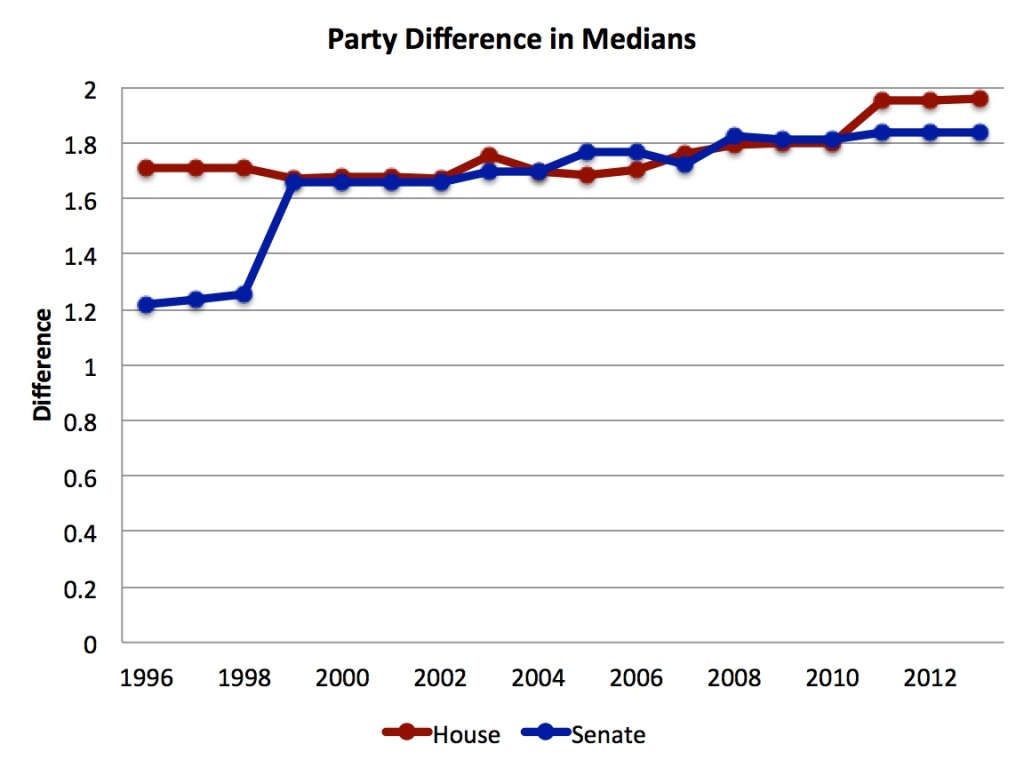
In both the House of Delegates and the Senate, differences between the median Republican and median Democrats in each chamber have widened over time , as the figure below shows. (If there were no difference in the ideology of each member, the difference measure would equal zero.)

MedianPartyDiff

Since 1996, partisan differences in the House of Delegates have increased from 1.71 to 1.96–a gain of 15%. The Senate started with lower polarization but has now almost caught up as differences rose from 1.22 to 1.84–a gain of 51%.

The rise in polarization is not due entirely to changes in the ideology of just Republicans or just Democrats. Republicans have become more conservative while Democrats have moved to the left. The median House Democrat is now 13% more liberal than in 1996 and the median House Republican is 17% more conservative.

HoDMedians

The same process has occurred in the Senate, though Republicans have lurched more to the right than Democrats have to the left. The biggest change occurred after the 1998 elections when several moderate Republicans were replaced by more conservative members of their party.

SenateMedians

Since 1996, Democratic liberalism has risen by 16%–a comparable change to that in the House–but Republican conservatism has shot up by 264%. This change is less drastic than it sounds. Senate Republicans in 2013 were still a tad less conservative than their counterparts in the House.

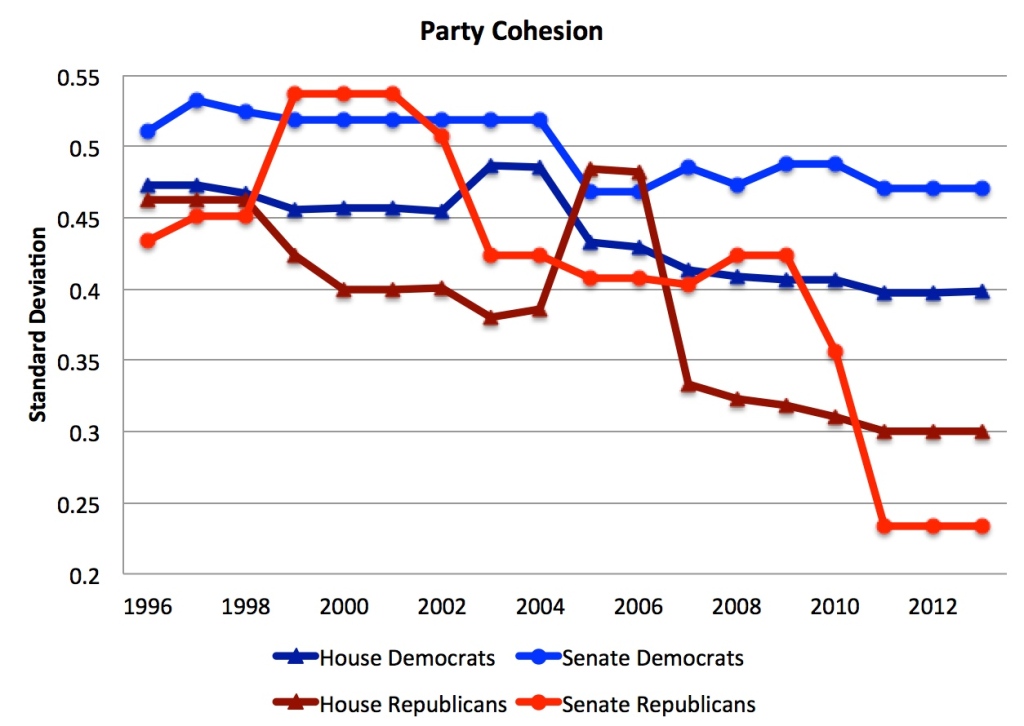
The party caucuses have not just become more ideologically different. They have also become more cohesive. The following figure shows the standard deviation in the Shor-McCarty scores for each year and party in both houses:

PartyCohesion

The decline in the standard deviation means that there is less variation around the average score for each party. In other words, Republicans are not just more conservative, they are also more cohesively conservative. The same is true for Democrats. But Democrats were much less cohesive than Republicans in 2013, reflecting that more moderate Democrats had survived than moderate Republicans.

Next up: the likely impact of the 2014 elections.

Share

General Assembly Results

Based on results from last night, Republicans have made limited gains in the new General Assembly: two seats in the Senate and seven seats in the House of Delegates. Veto overrides take 3/5 in each House–29 in the Senate and 85 in the House. As a result, there are not enough Republicans to sustain a gubernatorial veto with support from at least some Democrats.

Here are the tentative General Assembly results:

newgenlassem

Share

Superstars in Waiting: The Freshman Democratic House Class

Without an unprecedented General Election upset, the following Democratic nominees for House Seats will be sworn into the General Assembly for the 2015 Session. These legislators show particular promise:

1) Brooke Lierman – The new face of South Baltimore is young, white, wealthy and progressive. Brooke is all of these things (And DC powerhouse Terry Lierman’s daughter). Despite a convenient last name, she fully deserves her seat in the House on her own merits (going back to the campaigns of Paul Wellstone and Howard Dean) up to her present day practice as a civil rights lawyer.

2) Erek Barron – An Attorney at Whiteford, Taylor & Preston, the newest addition to the District 24 Delegation has tremendous statewide potential. A former prosecutor (as an ASA in Prince George’s and Baltimore City as well as at the Department of Justice) who worked for then US Senator Joe Biden on Capitol Hill, Erek has as sterling a resume as any legislator. He also has an easy going charm and keen intelligence. Bonus Points: he played foot ball at College Park.

3) Marc Korman – This Sidley Austin Attorney and former Capitol Hill Staffer (not to mention a former blogger at Seventh State predecessor Maryland Politics Watch) has always been the smartest guy in the room–and that definitely won’t change when he gets to the Lowe House Office Building.

4) Andrew Platt – A very, very sharp former US House Leadership staffer cruised to victory and is set to become the youngest legislator in Annapolis. He has future leadership written all over him.

5) Cory McCray This East Baltimore IBEW Leader is charming and exceedingly genuine. He ran an incredibly strong campaign this year and is sure to rise quickly in Annapolis as a powerful voice for working families in the state.

6) David Moon – Attorney and Political Operative David Moon is sure to establish as a liberal lion in the legislature as he marries his communication skills with sharp progressive politics. He will represent his new constituents in Takoma Park well.

7) Will Smith – Despite (perhaps unduly harsh) criticism of his campaign budgeting decisions on this blog (by me), Will Smith cruised to victory on June 24th with the help of a slate led by Jamie Raskin. His future in this state couldn’t be brighter.

These are the future County Executives, Congressman, MGA Committee Chairs, Attorneys General, Comptrollers, Lieutenant Governors of the coming 10-15 years.

Note: This post was modified from the original version because Candice Quinn Kelly lost her close race.


Share

On Legislative Pay Raises

enterprise-tos

Today, the Seventh State goes where no one has gone before: defending salary increases for state legislators.

It’s always easy to bash legislative pay increases. No one likely politicians with the stereotype being the proverbial fat cat. The proposal to raise legislator salaries from $43,500 to $53,330 over the next four years thus makes for an easy target, especially in election season.

Less mentioned is that the proposal also imposes on legislators  changes to their pensions similar to those that they placed on state employees as part of the effort to place the pension fund on a more even keel:

[The Commission also] proposed some of the same adjustments to legislative pensions that the General Assembly imposed on state employees and teachers in 2011. The commission suggested raising legislators’ contribution rate from 5% to 7% of their salaries, raising the retirement age from 60 to 62, and raising the early retirement age from 50 to 55.

People like to focus on the idea of legislators trying to raise their own pay.  Neglected is that the salary increases are recommended by an independent commission mandated in the Maryland Constitution:

Within 15 days after the beginning of the regular session of the General Assembly in 1974 and within 15 days after the beginning of the regular session in each fourth year thereafter, the Commission by formal resolution shall submit its determinations for compensation and allowances to the General Assembly. The General Assembly may reduce or reject, but shall not increase any item in the resolution.

Todd Eberly has pointed out that the new pay level is higher than the American median family income. However, it’s almost exactly equal to U.S. median household income in 2012 and well below the median Maryland household income of $72,999–not too surprising since our state is currently the wealthiest in the country.

Median household income is even higher in some of the largest counties, such as $73,568 in Prince George’s, $96,985 in Montgomery, $86,987 in Anne Arundel, $107,821 in Howard, $83,706 in Frederick, and $93,063 in Charles.

Of course, being a legislator is only supposed to be a part-time job. The General Assembly is in session for 90 days per year. Except that many professions aren’t too keen on hiring someone who has to be out for three months per year and is also liable to disappear when the Governor calls for special sessions.

Any legislator who is doing their job properly, moreover, also works hard outside of session on both constituent and legislative matters. It may not be a full-time job but it’s far from being active for only 90 days per year.

Claims of the easy life remind me of the similar statements made about teachers and college professors. Both have to engage in lesson preparation and grading outside of class. There are also numerous committees, recommendations and other responsibilities that are part of the job. College professors spend less time on these matters than teachers but also have research expectations.

Others point out that lots of people want these jobs, so why don’t we just lower their salaries? Certainly, Republicans don’t take this approach to CEO pay. Most people wouldn’t prefer to hire the cheapest person regardless of quality as a teacher, babysitter, or to do repairs on their home unless they have no choice.

When we limit legislative pay, we limit the pool of people who are willing to take–or can afford to take–the job. The whole idea of “you get what you pay for” seems thrown out the window . The situation is especially complicated in Maryland because we don’t have either a “professional” legislature like California or a clearly part-time one like New Hampshire or Wyoming.

Perhaps the worst idea is the one proposed by Republicans to adjust pay increases to metrics such as unemployment in the State. While, like Republicans, I believe that government can wreck the economy, I don’t think that it can necessarily counter overall national or world trends in this area.

It’s positively weird for the party that believes government is the problem to express support for a policy that assumes that legislators have some sort of magical control over the economy. I also didn’t exactly hear national GOPers rush to take responsibility at the national level during the 2010 and 2012 elections after the economy slid down the can on their watch.

The point here is not that the sky is the limit on legislative salaries. But maybe a little more thought is needed before deriding pay increases. Fewer canards and more thought are needed.

Share

Dems Way Ahead in GA after Filing Deadline

The votes are not in. Not a single ballot has been counted. Even in the primary. But the Democrats are already well on their way to retaking the General Assembly in 2014.

The filing deadline has passed. Democratic senatorial candidates face no Republican opponent in 18 legislative districts compared to just 5 Republicans without Democratic opponents. Democrats have to win just five more LDs to regain their majority.

On the House side, Democrats have effectively already won 52 seats, as Republicans have filed too few candidates in many districts to gain seats even if they won. In contrast, Democrats have left Republicans unopposed for just 5 seats. Democrats need just 19 more House seats for a majority.

In short, Democrats have already won 38% of Senate seats and 37% of House seats due to the lack of opposition. Republicans have won 11% of Senate seats, meaning that just under one-half of all LDs lack two major party candidates. The Republicans have won fewer House seats–under 4%–by default. Nearly 60% of seats for the House of Delegates will have full competition in the general election.

(Note: I’ve ignored third-party candidates here as none of them seem to have any possibility of victory.)


Share