Category Archives: turnout

MoCo Dems Who Don’t Vote, Part Three

Today, I am pleased to present a guest post by Adam Pagnucco:

Age is the biggest difference between MoCo Democrats who always vote in gubernatorial general elections and those who don’t.  Here are a few other differences.

Household Income

The voter registration file contains the addresses of all registered voters.  The Census Bureau tracks household income over the 2009-2013 period by zip code, municipality and owner vs renter status.  We integrated Census income data with the voter file and found these voting patterns.

MoCo Democrats Average Household Income

Super-Dems and non-voters can be found in every income group but there is a correlation between voting and income.  The average household income of super-Dems is 17% higher than non-voters.  Super-Dems are more likely to have household incomes of $200,000 or above (19%) than are non-voters (11%).  Conversely, non-voters are more likely to have household incomes of under $100,000 (23%) than super-Dems (12%).

Geography

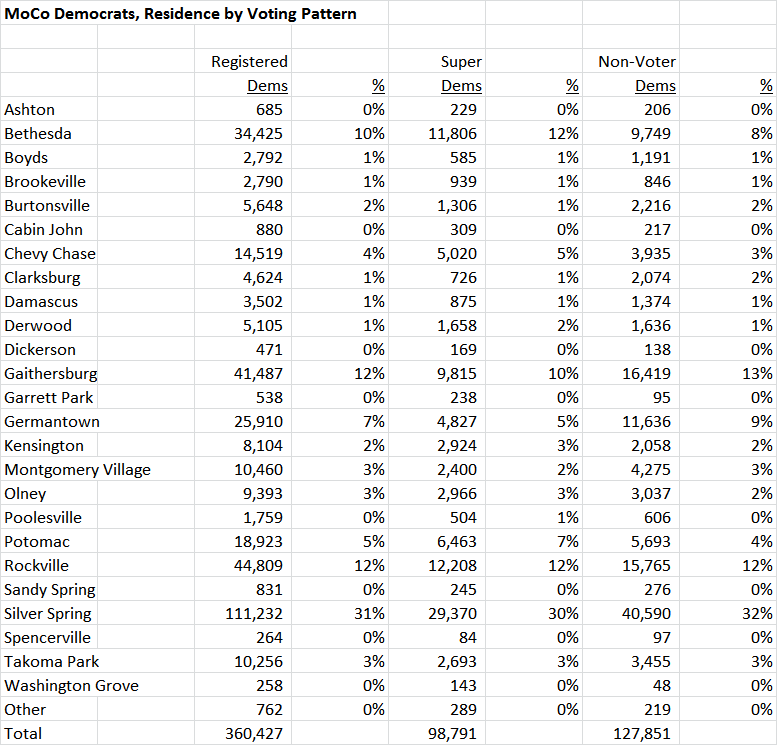
Super-Dems and non-voters also tend to have different residence patterns.  Below are their distributions by city and town.

MoCo Democrats Residence

Super-Dems are most likely to live in Kensington, Chevy Chase, Bethesda and Potomac, in that order.  Non-voting Dems are most likely to live in Germantown, Clarksburg, Montgomery Village and Gaithersburg, in that order.

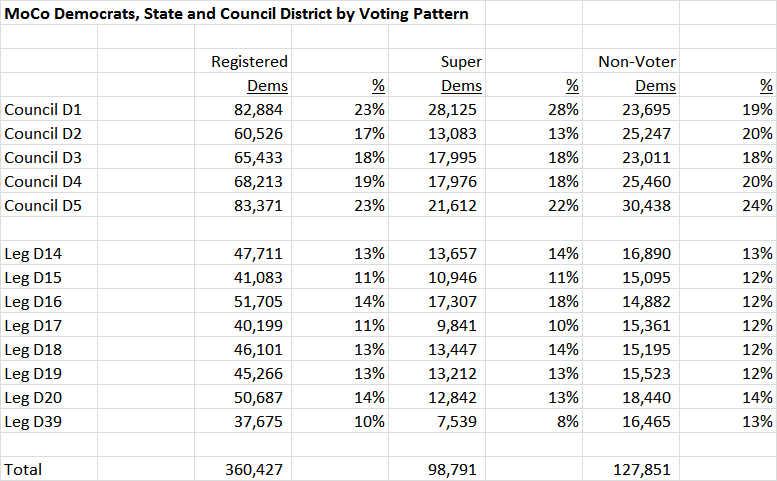
Below is the same data presented by council and legislative district.

MoCo Democrats by District

Super-Dems are most likely to live in Council District 1 and Legislative District 16 – again, in the BCC-Potomac vicinity.  Non-voting Dems are most likely to live in Council District 2 and Legislative District 39, which contain Germantown and Montgomery Village.

Race

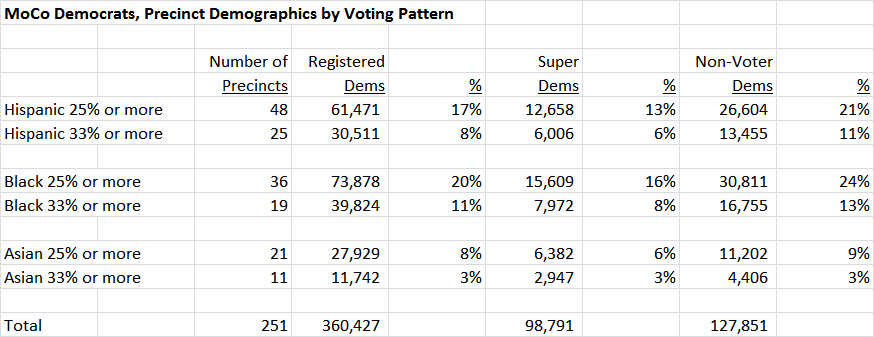
The voter file does not contain racial data.  But the Census Bureau does have racial data by Census tract, and we integrated that into the voter file.  Below is the distribution of super-Dems and non-voters in the precincts that have the highest percentages of black, Hispanic and Asian residents.

MoCo Democrats Race

Voting patterns in Asian precincts don’t vary much.  But non-voters are significantly more likely to live in precincts with high black and Hispanic populations than super-Dems.

In summary, the following characteristics apply to super-Dems in order of likelihood.  Super-Dems are most likely to:

  1. Be age 60 or over
  2. Be age 50-59
  3. Live in Kensington
  4. Have average household incomes of $200,000 or more
  5. Live in Chevy Chase
  6. Live in Bethesda
  7. Live in Potomac
  8. Live in Council District 1

Non-voting Dems are most likely to:

  1. Be age 39 or younger
  2. Live in Germantown
  3. Live in Clarksburg
  4. Live in precincts that are 33% or more Hispanic
  5. Live in Legislative District 39
  6. Have average household incomes of less than $100,000
  7. Live in precincts that are 33% or more African American
  8. Live in Council District 2

How can the non-voting Dems be turned into voting Dems?  We will conclude with a few suggestions to do that in Part Four.

Share

MoCo Dems Who Don’t Vote, Part Two

Today, I am pleased to present a guest post by Adam Pagnucco:

Who are these registered MoCo Democrats who don’t vote?  Let’s find out.

The table below presents data on registered Montgomery County Democrats from the January 2015 voter registration file.  As of that date, there were 360,427 registered Democrats in MoCo.  The file contains their voting histories in the primary and general elections from 2006 on.  Most MoCo Democratic candidates running in primaries, which tend to decide elections here, concentrate their voter contact on the 42,692 people who voted in each of the last three primaries.  (They account for 12% of MoCo Dems and 5% of the county’s voting age population.)  But for the purpose of this analysis, we will be examining three groups: all registered Democrats, those who voted in each of the last three gubernatorial general elections (Super Dems) and those who have voted in no gubernatorial generals (Non-Voting Dems).

MoCo Democrats by Voting Pattern

The first fact that stands out is that the non-voters are a larger group than the super-Dems.  There were 98,791 Democrats in the file who voted in each of the 2006, 2010 and 2014 general elections.  But there were 127,851 Democrats who did not vote in any of them.  That fact alone should worry state and county Democratic strategists who are looking to generate more turnout to defeat Governor Larry Hogan.

Another fact that stands out is that of the 127,851 Democrats who did not vote in any of the gubernatorial generals, 73,306 voted in at least one of the 2008 and 2012 presidential elections.  This group accounts for 20% of all MoCo registered Dems.  Why are they voting for President and not for Governor?  Let’s remember that Hogan’s statewide victory margin in 2014 was 65,510 votes.  If half of these presidential-voting Democrats showed up in 2014 and voted for Anthony Brown, Hogan’s margin would have been cut by more than half.  If half of all of the non-voting MoCo Dems had showed up to vote for Brown, Hogan’s margin would have been nearly eliminated.

Let’s zero in on a few demographic factors pertaining to MoCo Dems.

Gender

Women account for majorities of registered MoCo Dems, super-Dems and non-voters.  No surprise here.  Women dominate the rank and file of the Democratic Party even if they account for less than a majority of its elected officials.

MoCo Democrats Gender

Age

Age is the single most meaningful variable differentiating super-Dems from non-voters.  The average age of super-Dems is 61.  The average age of non-voting Dems is 39.  Fifty-three percent of super-Dems are age 60 or older.  In contrast, sixty percent of non-voting Dems are 39 or younger.

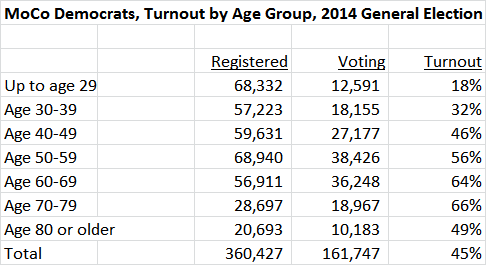
Here’s a different way of looking at age.  Following are the turnout rates for Democrats by age group in the 2014 general election.

MoCo Democrats Age Turnout

Democrats in their 60s and 70s were at least twice as likely to vote as Democrats in their 30s or younger.  Nearly 100,000 MoCo Dems in their 30s or younger did not vote in the 2014 general.

Low turnout among young people is not exclusive to MoCo – it’s a nationwide phenomenon.  But because so many young Democrats in MoCo are not voting, that suggests the party needs a strategy to get them to the polls to realize significantly higher turnout in 2018.

We will look at more differences between super-Dems and non-voters in Part Three.

Share

MoCo Dems Who Don’t Vote, Part One

I’m following the lead of my students and heading out of town on Spring Break. Fortunately, Adam Pagnucco has written a series on Montgomery Democrats who don’t vote. Today, I am pleased to present the first part:

General Assembly Democrats have decided to pursue automatic voter registration in this year’s session.  There’s a good policy rationale for it and efforts to increase resident access to voting are generally commendable.  There is also a fair dose of politics here. Democrats are pursuing this because they think it will net them more votes, and Republicans are opposing it for the same reason.  Yet, there’s little evidence in our state that increasing registration will automatically increase votes for Democrats in gubernatorial elections.

Instead of concentrating on people who don’t register, Democrats should look at a different group for the purpose of expanding their turnout: people who register as Democrats but don’t vote.

Why do people register but don’t vote?  Part of the explanation lies in how relentlessly targeted modern political campaigns are.  In a context of scarce resources, campaigns strive to touch voters who a) are likely to actually vote and b) are potentially receptive to the candidate’s message.  That means orienting mail, email, field operations and even social media towards voters with regular histories of voting.  Those voters who vote regularly get inundated with candidate communications.  Those who don’t get much less of it.

Consider me.  I moved to the county in 2003.  I had a long history of voting in D.C. and New York but that didn’t show up in my Maryland voter registration record.  I voted in the 2004 primary and general elections.  In my first state-level election of 2006, only two candidates sent me mail: Hans Riemer and Duchy Trachtenberg, both non-incumbents running for the County Council.  Both had well-financed operations and perhaps they felt they could take a chance on appealing to a wider field of voters than just those who had voted in 1998 and 2002.  County Executive candidates Ike Leggett and Steve Silverman, who raised over $3 million between them, didn’t contact me.

Now, if I was feeling ignored, that didn’t last!  I continued to vote regularly and by 2010, I got lots of mail.  Don’t ask me about 2014.  My recycling can is still recovering.

So what is likely to happen to all the new voters who are automatically registered under the state Democrats’ proposal?  They will probably be ignored by Democratic candidates for state and local office because they don’t have voting histories.  Some of them might vote in presidential elections because information on those candidates is easy to come by.  (Who on Planet Earth has not heard of Hillary Clinton or Donald Trump?)  But a combination of declining local media coverage and micro-targeted local campaigns will give them no information on local races and lots of them will sit out.

That is exactly what is happening in Montgomery County.  From the 1990 general election through the 2006 general election, voter registration rose from 365,960 to 507,924 – an increase of 39%.  At the same time, the actual number of general election voters rose from 211,199 to 308,429 – an increase of 46%.

Now let’s remember what happened around the end of that time period.  The presidential campaigns of Howard Dean and Barack Obama took voter targeting to a new level with email, data-mining and (later) social media.  Campaigns became much more efficient at reaching small groups of likely voters.  And all of this filtered down into state and local races, especially in MoCo, where so many candidates and campaign staffers have ties to the national level.

This had an impact in Montgomery County.  From the 2006 general election through the 2014 general election, voter registration rose from 507,924 to 634,663 – an increase of 25%.  But the actual number of voters dropped in 2010 and again in 2014.  The 2006 general saw 308,429 voters while the 2014 general saw 267,456 voters – a decline of 13%.  At the same time, the number of MoCo voters in presidential general elections has been rising steadily in every cycle since at least 1990.

What we are witnessing now is a shrinking snowball effect.  As each gubernatorial cycle passes, the pool of targeted voters shrinks as people who vote regularly pass away or move out.  And those without voting histories are ignored by candidates, and don’t vote, and so their numbers grow.

This should be a major concern for both Maryland and MoCo Democrats, because low turnout in MoCo (as well as Baltimore City and Prince George’s) significantly contributed to Larry Hogan’s winning the Governor seat.  More registration won’t fix it.  More efforts to turn out an ever-smaller group of regular Democratic voters won’t fix it.  But communicating with people who are already registered Democrats and who, for whatever reason, aren’t voting just might fix it.

So who are these Democrats who don’t vote?  We’ll find out in Part Two.

Share

Does Making Registration Easier Cause More Voting?

Today, I am pleased to present a guest post from Adam Pagnucco:

In this year’s session of the General Assembly, Democrats will be introducing legislation providing for automatic registration of voters.  While the details vary between proposals, the concept is that state agencies would proactively “forward to election officials data about anyone who meets the age, residency and citizenship criteria to vote.”  Individuals would be allowed to opt out if they wish.  Democrats clearly believe this would increase the number of voters who support their party.  Republicans also believe that since they are openly opposing the idea.

Are they right?  Would more registration lead to more voting?

The State of Maryland has taken many steps to make registering and voting easier, including early voting (2010), online registration (2012) and expansion of early voting from six to eight days (2013).  Same day registration during early voting will be in effect for the first time in 2016.  The state has also offered applicants for driver’s licenses the opportunity to register as voters in conformance with federal law since 1995.

Maryland has seen steady increases in voter registration over the years.  The graph below shows statewide registered voters in both primary and general elections since 1990.  While there are slight variations in individual cycles, registration has gone up by about 4-5% every two years.

Voter Registrations graph

Has that resulted in more voting?  Much has been made of declining turnout in the past, and there is something to that: the turnout rate has fallen from 61% in the 1994 general election to 47% in 2014.  It has also declined from 81% in the 1992 general election to 74% in 2012.  But looking at the turnout rate alone can be misleading.  If the number of actual voters increases at a slower rate than the number of registered voters, the turnout rate can fall even if actual voting rises.  In fact, if more aggressive voter registration outreach brings in voters who are less likely to vote, that is exactly what could happen.  The test here is whether actual voting is going up along with registration.

First, let’s look at primaries.  The graph below shows the total number of primary election voters in Maryland since the 1990 elections.  These elections are very sensitive to the circumstances of offices on the ballot.  At the gubernatorial level, primary voting peaked in 1994, 2002 and 2006.  The former two years saw open Governor seats while the latter saw a rare competitive U.S. Senate race.  Primary voting tanked in 1990 and 1998, when incumbent Democrat Governors were running for second terms.  At the presidential level, primary voting surged in 2008 when Barack Obama was in a competitive race with Hillary Clinton.  Primary voting fell dramatically in years when an incumbent President was on the ballot (1996, 2004 and 2012).  These candidate dynamics overwhelmed any effects of increasing registrations.

Primary Voting graph

General elections see much steadier patterns of voting.  The graph below shows the total number of general election voters in Maryland since the 1990 elections.  The absolute number of voters in both gubernatorial generals and presidential generals has been rising steadily since the 1990s – with the notable exception of a divergence in the 2010-2014 period.  Presidential voting has gone up every year since 1996, but gubernatorial voting went down between 2010 and 2014.  This is the same period during which early voting (2010), online registration (2012) and an increase in early voting days (2013) were implemented.

General Voting graph

Let’s look at this presidential vs. gubernatorial split more closely.  The popularity of President Barack Obama may be a factor in increasing the number of voters in recent presidential elections.  Obama gained 62% of the vote in Maryland in both 2008 and 2012 and his approval rating in Maryland has been above 50% for most of his time in office.  The chart below shows changes in registrations and voting for each Maryland jurisdiction between the 2004 and 2012 general elections.  The two counties that gave Obama more than 80% of their vote in 2012 – Baltimore City and Prince George’s County – saw increases in both registrations and the number of actual voters greatly exceeding state averages.  Counties opposing Obama saw rises in registration and voting too, but not nearly as much.

Presidential Voting chart

The gubernatorial elections tell a very different story.  The chart below shows changes in registrations and voting for each Maryland jurisdiction between the 2010 and 2014 general elections.  Statewide, registrations were up by 7% while the number of voters fell by 7%.  But voting behavior differed between counties supporting Larry Hogan and those supporting Anthony Brown.  In the ten jurisdictions that gave Hogan 70% or more of their vote, the actual number of voters fell by 3%.  In the four jurisdictions that supported Brown, the actual number of voters fell by 8%.  Registrations rose by 7% for both groups.

Gubernatorial Voting chart

Increased registration has coincided with more voting in presidential elections and less voting in the 2014 gubernatorial election.  Why is that happening?  Here’s a theory: voters have access to much more information about presidential candidates than state or local candidates and are therefore more likely to vote for the former.  In fact, state and local candidates target voters with long histories of regular voting with their mail and field programs while they ignore voters with sparse histories – including new voters.  Declining local media coverage of state and local races reinforces this information gap.  So the registration efforts of Democrats through legislation and party activities may help fortify the margins of presidential candidates and federal candidates running in presidential years, but they did not help the party in 2014.  Not only did the Democratic nominee for Governor lose, but the Republicans picked up a record number of seats in the House of Delegates, captured the Howard County Executive seat and almost knocked off Congressman John Delaney – all while voter registration was rising.

There’s nothing wrong with making voter registration more convenient.  But given the above, there is little evidence to suggest that Democrats at the state and local level will significantly benefit from it.  There is also little evidence that Republicans should fear it.

Share

Analysis: Van Hollen Wins Rural Straw Poll

Chris Van Hollen received 80% support in a straw poll for the U.S. Senate primary held at a summit of rural Democrats. So far, only Van Hollen and his colleague in the U.S. House, Donna Edwards, have jumped in the race for the Democratic nomination.

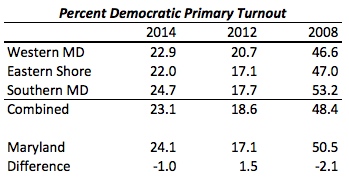
In heavily suburban Maryland, how important are rural voters in a Democratic primary? The following table shows the share of all Democratic primary voters in Maryland’s three rural regions in the 2008, 2012, and 2014 Democratic primaries:

RuralPDemFor purposes of this table, Western Maryland includes Garrett, Allegany, Washington, Frederick and Carroll Counties. Southern Maryland is Calvert, Charles, and St. Mary’s Counties. The Eastern Shore includes the nine counties east of the Bay. (Of course, these counties also include some urban and suburban areas.)

Together, these three regions hold approximately one-sixth of Maryland’s Democratic primary voters. Despite their reputation as mostly Republican turf, no candidate will want to ignore this many voters. Moreover, the media market centered on Salisbury is also far cheaper than the other Maryland markets.

Democratic primary turnout in rural Maryland has differed by 2.1% or less than the State as a whole and has not been consistently higher or lower than the rate for all Democrats:

RuralPDemTOThe difference hasn’t varied that much regardless of the overall level of turnout. However, the 2012 results suggest that, perhaps, rural voters are slightly less likely to stay away in low turnout contests. In that race, rural turnout exceeded the rest of the State by 1.5%. In contrast, rural Democratic primary turnout was lower than the State as a whole in the higher turnout 2008 and 2014 primaries.

Share

CD8: Where are the Voters?

Building on Adam Pagnucco’s analysis from yesterday, I thought it would be great to delve into voter turnout in past Democratic primaries within the Eighth Congressional District. My gratitude to the reader who provided me with this extremely interesting registration and turnout data.

Registered Democrats by State Legislative District

So where do registered Democrats live and which ones are more likely to vote? The first table shows the current number of registered Democrats along with past primary turnout broken down by state legislative district. Note that the data include only the portion of state legislative districts within CD 8.

TO1 Past VH x SHD

D16 holds 19.8% of registered Democrats and an even higher share of actual voters. In Democratic primaries from 2008 through 2014, D16 residents formed at least 21.0% and as much as 22.2% of voters. D16 is the most highly educated district in Maryland–and quite possibly the country–and studies show that education is more strongly related to voter turnout than any other factor. These numbers should encourage Del. Ariana Kelly.

In contrast, these numbers are less favorable to Sen. Jamie Raskin (D-20). Though D20 is chock-a-block with registered Democrats, not all of D20 is in CD8. As a result, D20 is home to just 16.9% of registered Democrats in the Eighth, probably less than many expect though still high.

Moreover, turnout within the D20 portions of CD8 is erratic. In 2014, D20 Democrats voted at a relatively high rate in the primary and constituted 17.6% of CD 8 Democratic primary voters. But their share in the district never exceeded 15.8% in the Democratic party primaries held from 2008 through 2012.

The second biggest stronghold of potential Democratic primary voters in CD 8 is D18, as it is home to 18.8% of all of registered Democrats. Turnout effects are smaller than in D16 or D20 with the share of D18 Democrats among all of the Eighth’s primary voters ranging from just 18.2% to 19.6%.

Del. Kumar Barve (D-17) suffers not only from the split in his district between the Sixth and Eighth Congressional Districts but the relative paucity of Democrats. Barve currently represents just 8.5% of the Eighth’s registered Democrats. They also tend to under perform on primary day, as their share of CD 8 voters ranged from 7.7% to 8.2% in the past four Democratic primaries.

Finally, it is worth noting that 17.9% of registered Democrats living in the Eighth don’t live in Montgomery County, so candidates will want to spend time and advertise in these areas. Fortunately for candidates, only around 8% of registered Democrats live in Carroll County, located in the Baltimore media market.

The rest live in the very expensive Washington media market where the vast majority of viewers are not registered Democrats living in the Eighth District. Less pricey social media will be extremely popular this year. But candidates cannot forget traditional media, as the primary electorate skews very old.

Registered Democrats by State Legislative and County Council Districts

The second table breaks down the share of registered Democrats by state legislative district and county council district:

TO2 Dem RV x SHD x County Council

Montgomery Councilmember Roger Berliner (D-1) represents 26.9% of CD 8’s Democrats but he has declined to enter the race. However, Montgomery County District 5 holds 22.5% of registered Democrats in the Eighth–a higher share than any state legislative district. Rumored congressional candidate and former Councilmember Valerie Ervin represented a slightly differently configured version of District 5.

At-Large Montgomery Councilmember Nancy Floreen has publicly mused about a run for Congress. She represents 81.8% of registered Democrats in CD 8, an overlap that any other of the rumored candidates would envy. But, as Adam pointed out, she has only run in the multimember at-large district, so the congressional race would be a different. Nevertheless, Floreen likely starts with higher name recognition than other candidates.

Likely Voters by State Legislative and County Council Districts

The final table breaks down the share of Democrats who voted in at least two of the past four primaries by state legislative district and county council district:

TO3 Dem 2 of 4 x SHD x County Council

Interestingly, this table reveals that D16 holds more people who are likely to vote in the primary than Council District 5. The high rates of turnout among D16 residents would bring Del. Kelly to parity with former Councilmember Ervin in terms of likely voters previously represented even though Ervin represented far more people.

Turnout only accentuates the Montgomery tilt of CD 8, as it is home to 82.5% of people who voted in at least one-half of the past four primaries. Among the remainder, 10.1% live in Frederick County as compared to 7.4% in Carroll County.

Based on this table, the most desirable pieces of real estate to have represented before in terms of Democratic primary turnout are:

1. Montgomery County (Floreen)
2. Montgomery County Council District 1
3. State Legislative District 16 (Kelly)
4. Montgomery County Council District 5 (Ervin)
5. State Legislative District 18
6. Montgomery County Council District 4
7. State Legislative District 20 (Raskin)
8. Montgomery County Council District 3
9. State Legislative District 19
10. Frederick County
11. State Legislative District 4
12. State Legislative District 17 (Barve)

Still, as Adam points out, all candidates have a lot of work to do to get known to most voters. Floreen and Kelly, who represent the most voters, have run only in multi-candidate contests. Other candidates have good bases but have run only in lower visibility races and in a portion of CD 8.

The keys to a good campaign remain the same: message, money, volunteers, and organization. Candidates need to have a message to sell to voters. They need money to pay for media to get it across and volunteers to spread the word and help canvass. But none of it matters if the candidate cannot run a a good strategic campaign.

Share

Spare Annapolis D.C. Dysfunction

masthead

Today, I am testifying at the House Ways and Mean Committee in favor of a bill sponsored by Chair Sheila Hixson (D-20) and Sen. Jamie Raskin (D-20) to establish a Blue Ribbon Commission on Voting, Openness, Transparency and Equality (VOTE). My opinion piece in today’s Baltimore Sun explains why:

It makes sense to get on the off ramp instead of heading directly into the blockages that plague the federal level. Reforms to the electoral system have the potential to encourage cooperation even as we respect the partisan differences that render our democracy vibrant. Happily, many of these changes can also encourage participation.

Capitol Hill looks like dysfunction junction. Let’s take a look at possible changes that could help prevent Annapolis from following that route.

The Committee for Montgomery, a broad-based alliance of business, labor, education, civic and community-based organizations played a key role in developing the ideas behind this bill.

Share

This is How You Do It

Two Democrats have shown how to make lemonade when life hands you lemons. This is just one of Delegate Ariana Kelly’s responses on Facebook to very low early voting turnout in her district:

ariana1

In other words, she used a negative–low Democratic turnout in early voting in her district–as a means to stimulate more people in her network to go out and vote. Call it early voting jujitsu.

Montgomery County Young Democrats President Nik Sushka is using the tightness of the gubernatorial race to similar effect:

Nik

In other words, instead of denying that there is a problem or just bemoaning it, use it to motivate supporters. Smart leadership.

Share

Early Voting: Final Stats

EVgraph

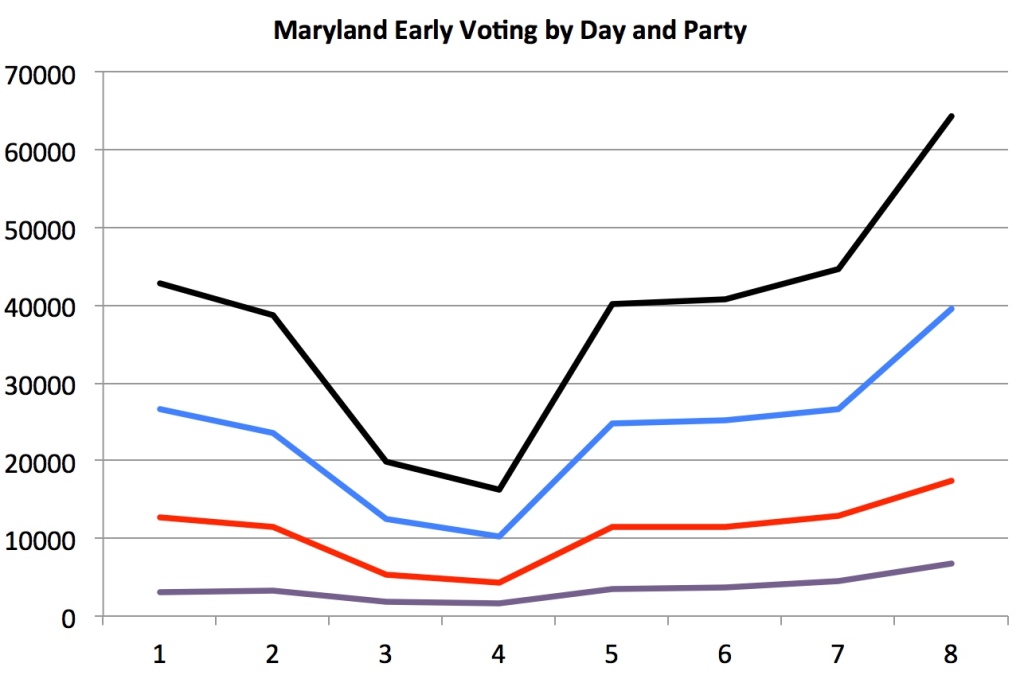
Turnout was way, way up on the final day of early voting with 64,247 Marylanders going to the polls. So far, 8.59% of all registered voters have cast ballots.

The Democrats had a especially good day. 1.94% of registered Democrats voted on Day 8 as compared to 1.83% of Republicans and 1.02% of unaffiliated voters. That brought the final rate of Democratic participation up to 9.29%–0.12% higher than the Republican rate of 9.17% and the unaffiliated rate of 4.30%

Indeed, Democrats have now finally posted a gain in the number of voters from 2010. The total number of registered Democrats who have voted is up 48,809 as compared to 28,509 for Republicans and 10,008 for the unaffiliated. That gives the Democrats an increase in their raw vote advantage over the Republicans of 20,300 votes banked from 2010. The increased advantage held by Democrats over Republicans and unaffiliated is 10,291–a nice reversal from the close on Day 7 for Team Blue.

However, the Republicans have done a better job of increasing their vote from 2010. The number of Democrats who voted early is up 34.8% in 2014 compared to 48.7% for Republicans and 54.6% for unaffiliated voters.

In short, Democrats have benefited from the expansion of early voting because more people voted and there are far more Democrats than Republicans in Maryland. But they gained less than they should have because the Republicans did a better job of turning out early voters than in 2010 and narrowed the gap with Democrats despite their strong Day 8 finish.

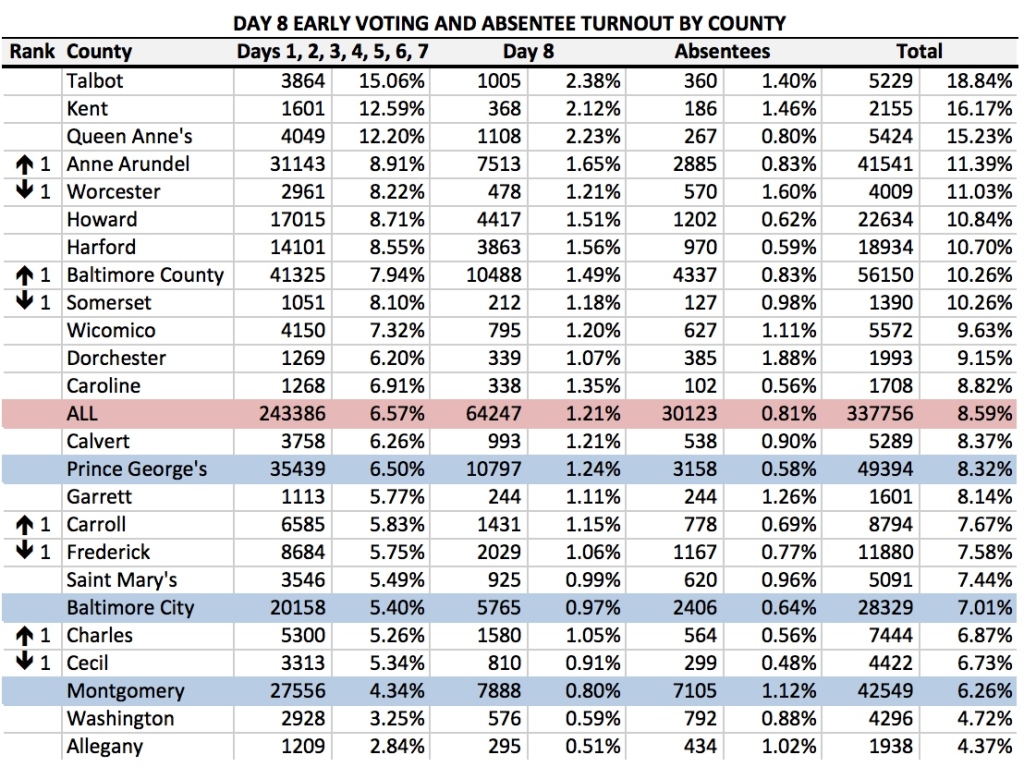
The following table shows the final tallies in each county. Clearly, counties in the Baltimore suburbs and Eastern Shore did a better job of turning out voters than those in the Washington region, Baltimore City, or Western Maryland. The county numbers correlate well with those from 2010 as @mdtruth has explained.

early8

In terms of county turnout on the final day, Prince George’s performed above the state average with 1.24% of Prince Georgians casting an early ballot, helping it finish not too far below the state average. Baltimore City and Montgomery continued to under perform with just 0.97% of Charm City voters and 0.80% of MoCO voters going to the polls.

And thus ends my first blog post ever from an airplane! I’ll try to provide more analysis later.

Share

Early Voting: Trick or Treat Edition

Early voting is over but as of 11:30 on Thursday night, the Maryland State Board of Elections has not posted the final numbers on early voting participation. Nevertheless, here are some thoughts as the opening act of this year’s elections come to a close.

1. The Impact of Early Voting is Overrated. Most studies of early voting indicate little effect on total turnout. Unsurprisingly, many early voters are people who would have otherwise participated on Election Day or voted absentee. The latter explains the decline in absentee ballots. EV provides opportunities for both parties but mostly convenience for voters.

2. Many lament that Election Day is not a holiday or we don’t vote on the weekend. Except that early voting dived by roughly 50% on a gorgeous weekend over early voting held on weekdays. Confirmation for political science studies that show zero relationship between free time and propensity to vote.

3. The Case for Republicans: Early voting was supposed to benefit Democrats and it was a bust. Despite an expansion in the days for early voting and number of early voting centers, Republicans have prevented Democrats from any net gains over 2010. And this occurred even though early voting increased and there are far more Democrats than Republicans in Maryland. Republicans increased their rate of turnout to match that of Democrats. Democratic turnout in the big three was terrible.

4. The Case for Democrats: Once the final numbers are released, the final totals will reveal a gain in raw votes for Democrats. Precisely because there are more Democrats, the addition of another 40,000 or so voters will result in the Democrats going into Election Day with a net gain from early voting. As @mdtruth has reported, 2010 turnout predicts 2014 turnout very well, so the lack of a net change is not a big surprise.

5. My Assessment: To the extent that it does matter, the evidence that either party has gained substantially over 2010 is thin. As of the end of Day 7, Republicans had a net gain of less than 2000 ballots over 2010. The number is around 5000 if unaffiliated voters are also included. But the numbers are still down for everyone if you factor in the decline in absentee voting, which is of course not yet complete.

6. But If I Must Pick a Winner: Republicans have more reason to feel pleased. Democrats had hoped that early voting would result in a substantial gain in votes banked in advance of Election Day. That hasn’t happened. And it’s hard to blame it on being a hard year for Democrats, as 2010 was worse. Nonetheless, @mdtruth has it right in that 2014 turnout correlates well with 2010 turnout. Any real impact on the final outcome is unclear and likely small.

I’m traveling this weekend but will see if I can report the final numbers at some point. And “in case I don’t see ya, good afternoon, good morning, and good night!”

Share