Category Archives: turnout

Early Voting Day 5 Stats

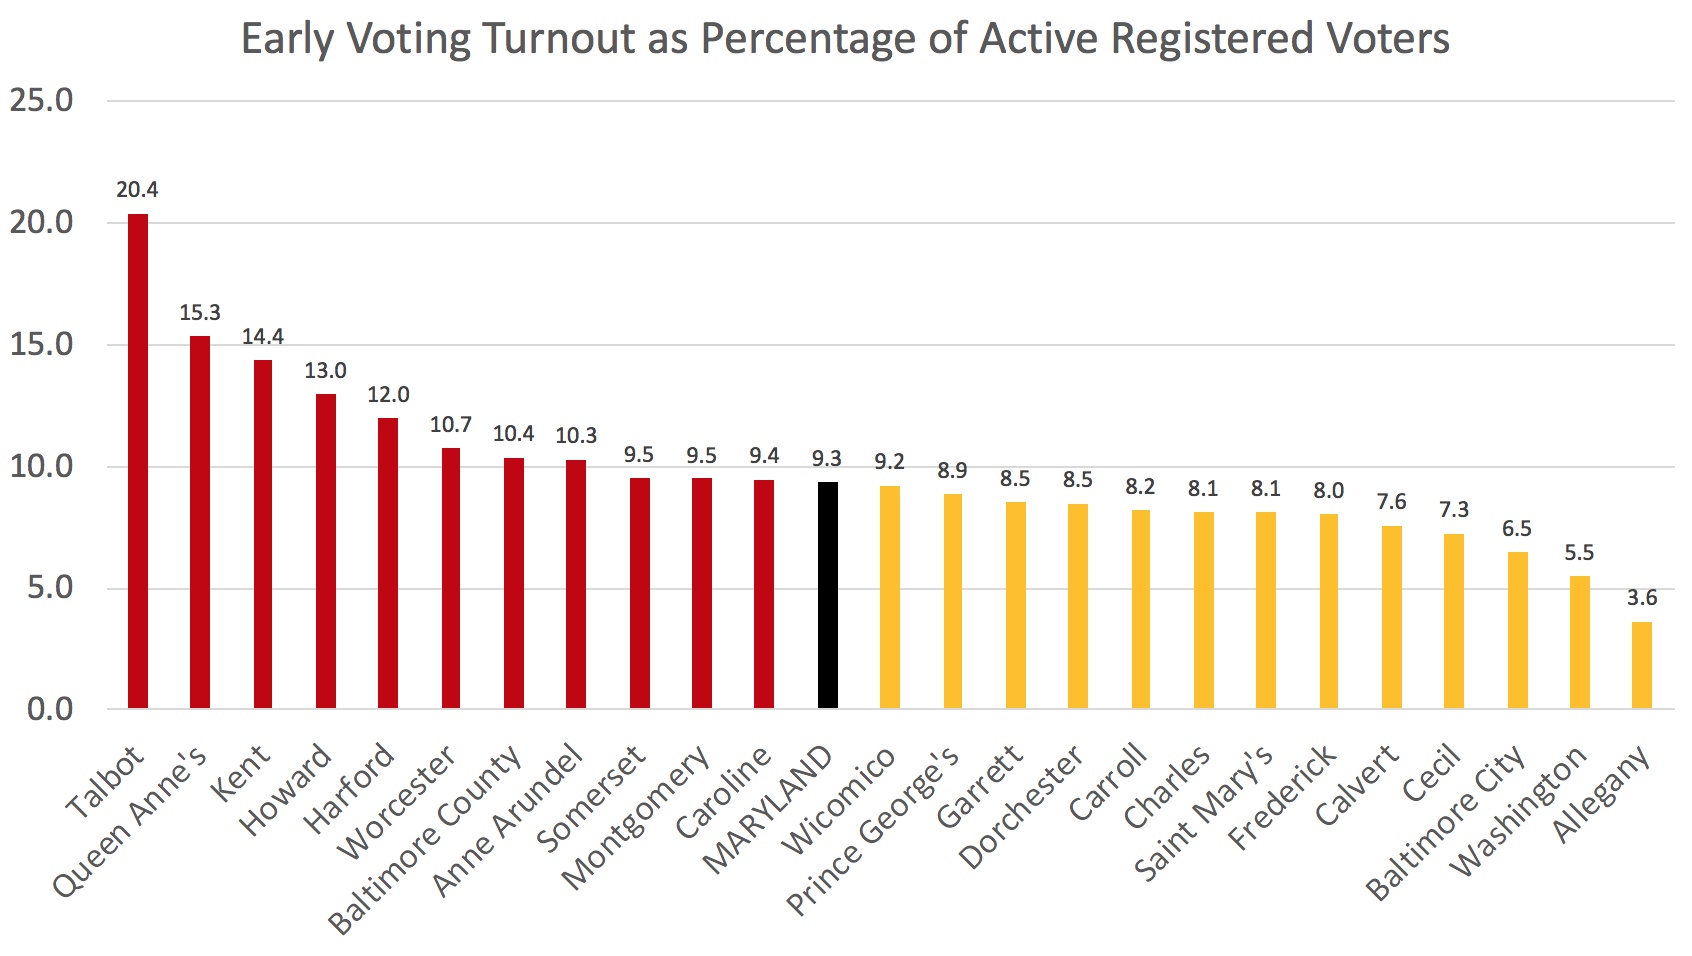
At the end of yesterday, 9.3% of registered Maryland voters had taken part in early voting. Talbot continues to lead the early voting pack as over one-fifth of its registered voters have now cast ballots. Allegany trails at the end with just 3.6% having participated in early voting. Indeed, all Western Maryland counties lag in early voting.

Most counties with hot executive races – Howard, Baltimore County and Anne Arundel – continue to have above average turnout but Frederick continues to be an exception. Montgomery has very average turnout despite its comparatively unusual three-way contest.

Most counties in CD 1 are also voting at high rates. Dorchester and Cecil continue to lag with Wicomico just below average but closing the gap with the state average compared to yesterday. It’s interesting to see Somerset in the above average category as this relatively poor county often has low turnout.

Share

MoCo Early Vote Day 5

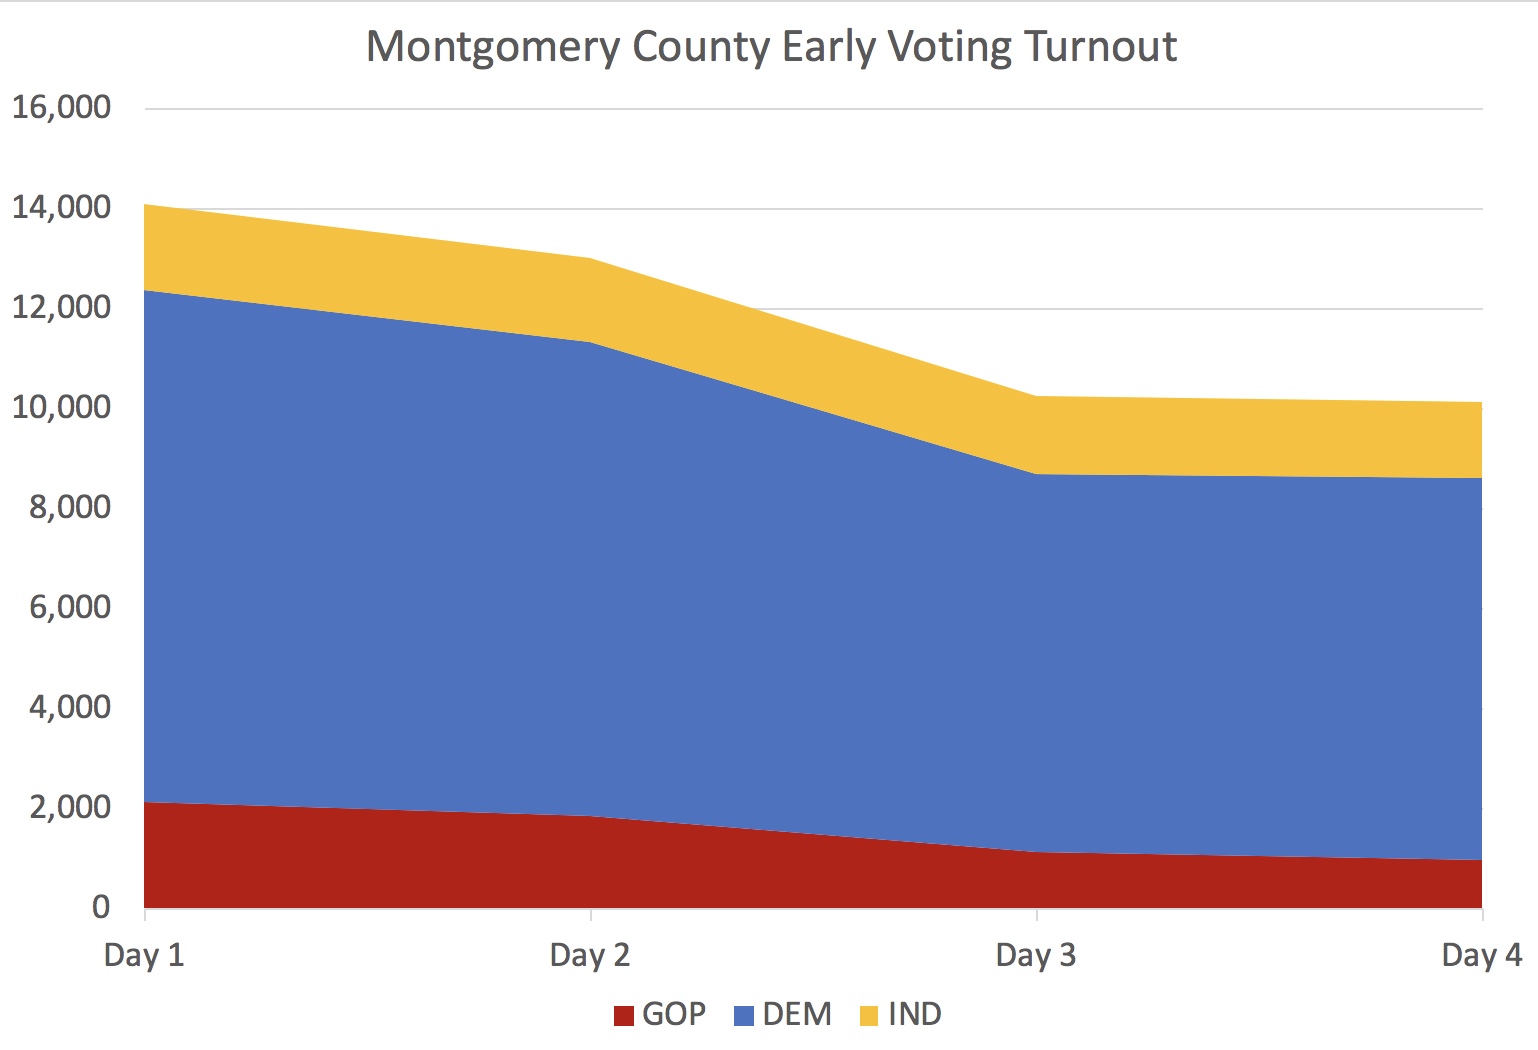
Early voting participation bounced back after the slow weekend to the highest so far this year in Montgomery, as 14,247 hit the polls – just 27 more voters than turned out on the first day.

These numbers, however, don’t reflect changes in the composition of who voted early in Maryland’s largest county, The 72.8% share of Democrats among early voters was up 0.7% over the first day. In contrast, the 13.0% share of Republicans was down 2.0% as the share of independents rose.

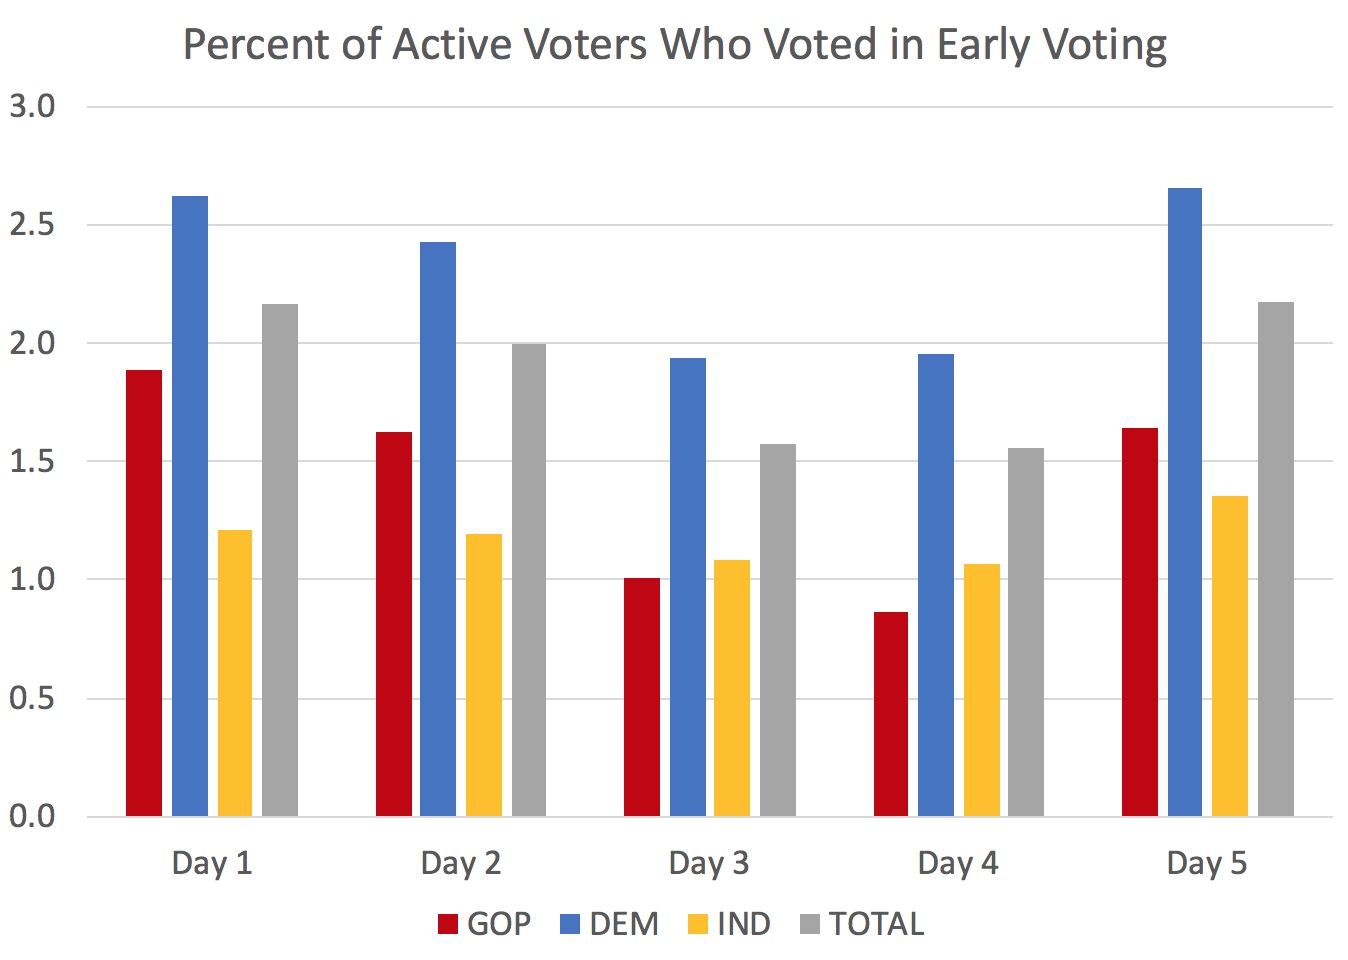
At the end of day 5, 11.6% of registered Democrats in Montgomery had voted early, compared to 7.0% of Republicans and 5.9% of Democrats. To the extent that Montgomery has been turning out at slightly above state averages, it’s due to Democrats.

While Republicans may make up the difference on Election Day, the banked votes allows Democrats to focus on a smaller number of people who haven’t voted yet. You begin to see why Republicans don’t like early voting.

Share

No Evidence of Blue Wave Youth Turnout in Maryland Early Voting

At the end of the fourth day of early voting, age appears heavily correlated with participation in early voting. According to the raw data released by the State Board of Elections, here are the number of people who early voted by age cohort:

18-24: 9,588.
25-44: 41,586.
45-64: 117,992.
65 and older: 101,787
unknown: 7,818.

Looking simply at the raw numbers, the old are casting early voting ballots in massively higher numbers than the young. For example, the 45-64 cohort had 284% more voters than the 25-44 cohort. Both cover 20 year periods (i.e. one generation).

What does it look like if you consider the rate of turnout rather than absolute numbers? I used the 2015 Maryland Department of Planning population estimates to gauge the size of each cohort’s population. (It’s not perfect as it includes non-citizens but gives a rough indicator. Age is reported in five-year groups, so I estimated the 18 and 19 year olds as 40% of all people ages 15-19.)

Here are the resulting estimates of early voting turnout rates:

18-24: 1.7%
25-44: 2.7%
45-64: 7.4%
65 and older: 14.4%

If anything, I suspect that this understates age differences. Remember that among Latinos and Asian Americans, two groups with large immigrant populations, kids are far more likely to be citizens than their parents because many were born in the U.S. and are citizens and eligible voters by right. As a result, the older cohorts likely includes higher shares of non-citizens.

Some might ascribe especially low rates among 18-24 year olds due to many people this age being away at college. This may indeed depress turnout figures somewhat but turnout rates among 25-44 year olds are also very low.

The Ben Jealous campaign has argued that the polls showing Hogan leading him handily are wrong because, among other reasons, they “undercount young people” who are “energized” about voting this year. So far, the early voting data suggest that no blue wave of young voters has arrived yet.

Share

What Explains Which Counties Have High Rates of Early Voting?

Earlier today, I presented data on the share of people who have voted early for each Maryland county. At the end of the fourth day of early voting, 7.1% of registered Marylanders had voted. The share across counties varies much more widely from 2.8% in Allegany to 15.5% in Talbot.

What explains the variation?

St. Mary’s Political Science Professor Todd Eberly suggested on Twitter that he thought there were signs of higher turnout in counties that (1) have competitive executive races, and (2) are in the First Congressional District. Is he right?

Two other hypotheses occurred to me: (3) turnout might be higher in counties with more older residents as age is associated with participation, and (4) race might also be associated with voting. In particular, Latinos and Asian Americans tend to vote at lower rates than whites or African Americans.

I created multivariate models of turnout at the end of the fourth day of early voting in order to test these hypotheses. The models allow one to assess the probable impact of one factor while controlling for others. However, the relatively small number of units in Maryland (24) precludes including too many variables.

So where are more people voting? Increasing the share of the population over age 50 by 2% raises the predicted share of early voters in a county by an estimated 0.59% (p = .02 for the statistically minded who are familiar with OLS models).

Counties in the First CD also seem to be participating at higher rates, though the effect is small. In counties in which 100% of registered voters live in CD 1, turnout is an estimated 0.02% higher than elsewhere in the state (p = .04). Though perceived as a safe Republican seat, voters there seem energized this year.

Counties with hot executive races (defined here as Anne Arundel, Baltimore County, Frederick and Howard) are seeing much higher early voting turnout. The estimated impact of close exec contest on the share of early voters at the end of day 4 is 2.75% (p = .04). Including Montgomery as a hot race causes the effect to vanish, suggesting that our unusual three-way race is not motivating EV turnout in the same way in MoCo.

Contrary to my expectation due to historically lower rates of Latino and Asian turnout, counties with more non-Hispanic whites seem to have fewer early voters. Increasing their share of the population by 2% is estimated to reduce EV turnout at the end of day 4 by 0.10%. However, the effect is marginal as statistical significance is normally assessed (p = .09) and I would interpret with especial caution.

Closer examination of the data reveals that any impact is driven by the presence of Latinos and that changes in the share of blacks have no real impact on EV turnout. Only Montgomery and Prince George’s have relatively high shares of Latinos (and MoCo also has the highest share of Asians), so I suspect that what is being captured by the model is that these two counties have relatively high turnout once you consider that they are not in CD 1, don’t have tight exec races, and the age of their populations.

In case you were counting, Todd Eberly wins the hypothesis prediction race. Both of his panned out while one of my two turned out to be a turkey-and Thanksgiving isn’t quite here yet.


Share

Early Voting Turnout around the State

The share of all active registered voters who have participated in early voting varies widely around the state from a low of 2.8% in Allegany to 15.5% in Talbot. In Maryland as a whole, 7.1% have cast ballots via early voting.

The state’s largest jurisdictions show quite a spread too. Baltimore City has had low early voting turnout at 4.8%, as has Charles at 5.9%. Prince George’s and Frederick are slightly below average at 6.2%. In contrast, Montgomery is just a bit above average at 7.3%.

The Baltimore suburbs are generally showing above average turnout. Baltimore County and Anne Arundel are a slightly above average at 7.8% and 7.9%, respectively. EV turnout is 9.2% in Harford, and 10.1% in Howard.

While Democrats are turning out at much higher rates than other voters in Montgomery, the share of Democrats does not appear related to overall voter turnout across counties. Indeed, two jurisdictions with lower early voting turnout have the highest rates of Democratic registration-Baltimore City and Prince George’s.

These are also the only two black-majority jurisdictions. Charles is on the edge and also turning out at below state average rates in early voting. (Montgomery is a majority-minority county but with a mixture of non-white groups composing the majority.)

Ben Jealous has repeatedly touted his ability to get minority voters out and his campaign claims that polls are not capturing high rates of minority voting. So far, however, early voting turnout in the state’s most heavily African-American jurisdictions is under performing the state as a whole.

Note that turnout might still be up relative to the past but this graph doesn’t provide evidence in support of world-beating early voting in heavily black jurisdictions (unless we also think that white turnout in these same areas is extremely low for some reason).

Share

Democrats Dominate MoCo Early Voting

As has been true in the past, early voting turnout in Montgomery was lower over the weekend. The basic trends, however, remain the same. Democrats comprise the great bulk of early voters in the county, forming 73.0% of all early voters to date.

In contrast, the share of Republicans who voted early, 12.7%, is currently lower than the 13.5% of independent (i.e. unaffiliated) voters who have voted. This is a change from the first day, when the absolute number of Republicans who voted outnumbered independents.

Democrats outnumber Republicans at the polls not only because there are far more of them – 390,400 as opposed to 112,995 Republicans and 142,173 independents – but because they are voting at higher rates.

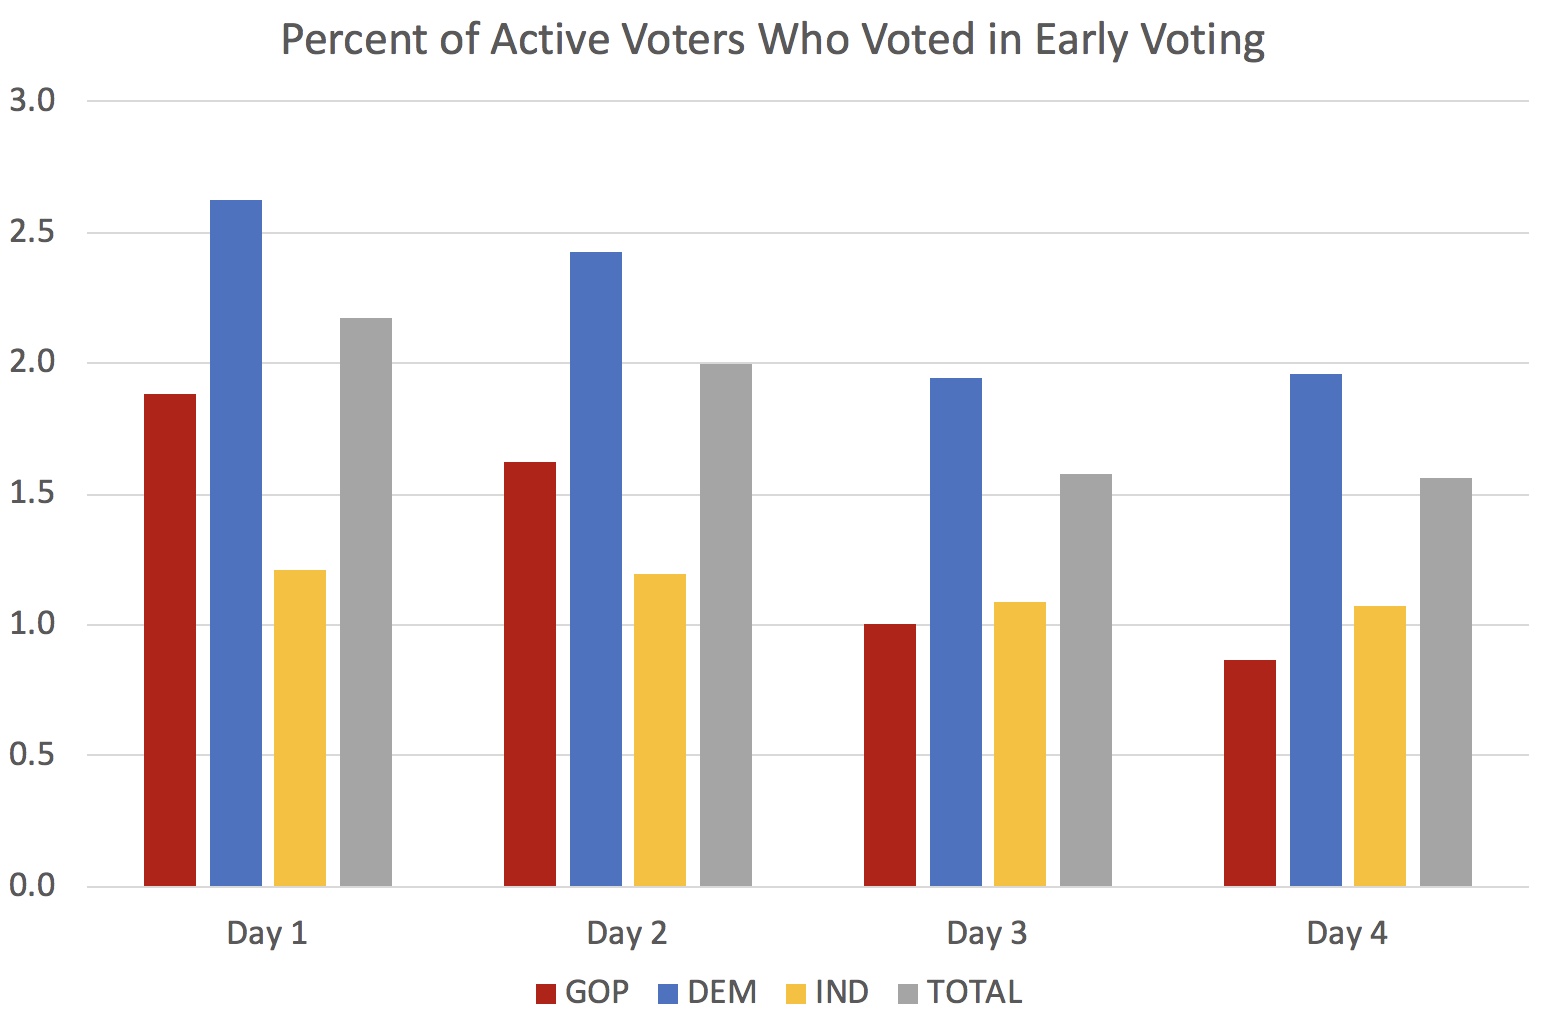
The share of Democrats participating in early voting has outpaced that of Republicans and independents on each of the first four days of early voting. After leading independents on the first two days, Republicans fell behind these voters who choose not to affiliate with a party over the weekend.

This is bad news for the Montgomery Republicans, as partisans normally participate at higher rates than independents. They will need to make up this difference through absentee voting and turnout at the polls.

The differences really add up over time. Right now, 9.0% of all registered Democrats (i.e. active voters) have voted in early voting. Only 5.4% of Republicans and 4.6% of independents have done the same. Put another way, Democrats are early voting 85% more often than Republicans and 96% more often than independents.

Remember, you can see wait times at early voting centers on the excellent Montgomery County Board of Elections website.

Share

So Who Voted on Day 1 of Early Voting?

Early voting has started in Maryland. The Montgomery County Board of Elections helpfully provided me with statistics on turnout on the first day as well as information on where you can vote early and the lines are shortest.

Is Early Voting Turnout up?

Depends upon how you look at it. In Montgomery County, 14,519 eager voters hit early voting centers yesterday. That’s way up from the 4,321 who did the same in the 2014 midterm election but still decidedly lower than the 21,888 who cast ballots on the first day in the 2016 presidential.

Among the participants, 10,468 were Democrats, 2,168 were Republicans, and 1,883 were unaffiliated, Libertarian or Green party registrants. Based on the number of voters registered at the time of the primary (I can’t seem to locate quickly statistics on current on more recent registration levels), that’s 2.3% of all registered voters.

Good News for Democrats

At the time of the primary, 59.1% of registrants were Democrats, while 17.6% were Republicans and 23.3% were unaffiliated or registered Libertarian or Green.

Early voting statistics look quite different. At the end of the first day, 72.1% of early voters were Democrats – 13.0% higher than their share of the electorate. In contrast, only 14.9% were Republicans, 2.7% less than their share of the electorate.

Unaffiliated voters were the least likely to show up at early voting. Only 13.0% of first-day early voters were unaffiliated (or minor party) registrants. That’s fully 10.3% less than their share of all registered voters.

This last statistic isn’t terribly surprising. While many self-identified independents lean towards one party or the other, core independents who don’t lean towards either party form roughly 10% of the electorate. As a group, these voters know less about politics and participate at lower rates than partisans.

I know someone out there is thinking that this can’t be right because they’re an independent who always votes and some independents are just disenchanted with the two major parties. Remember that this information speaks to the the group of pure independents as a whole and may not apply to individuals.

The data is certainly encouraging for Democrats. However, Republicans tend to be more likely to vote at the polls than take advantage of early voting, so it’d be a mistake to assure that the electorate will necessarily be vastly changed this year.

Early Voting Information

Montgomery County has eleven early voting centers scattered around the county. The county has put together a cool website that now only shows their addresses but has links to maps and wait times.

The center nearest you may not be the quickest if it has a long wait. Traveling just a bit further to another center or going to one near your place of work may take less time if it has no wait. The Damascas Recreation Center, the Mid-County Recreation Center, Sandy Spring Fire Department, and Saint Catherine Laboure tend to have shorter waiting times.

Same Day Registration

On the first day of early voting, 59 people took advantage of the ability to register to vote at early voting. An additional 71 had their address changed or updated. Voters approved same day voter registration during early voting in a 2014 referendum.

Currently, same day voter registration is only allowed at early voting. But voters have a chance to expand this opportunity to election day at the polls by voting FOR Question 2, which would amend the Maryland Constitution to that end. I strongly encourage a vote in favor of this constitutional amendment.

Share

MoCo Democratic Turnout: Precinct Results

By Adam Pagnucco.

Data Christmas has arrived as precinct results from the primary are now available from the State Board of Elections! We have been busy crunching them and will now begin rolling them out for our beloved readers.  Let’s start today with turnout among MoCo Democrats.

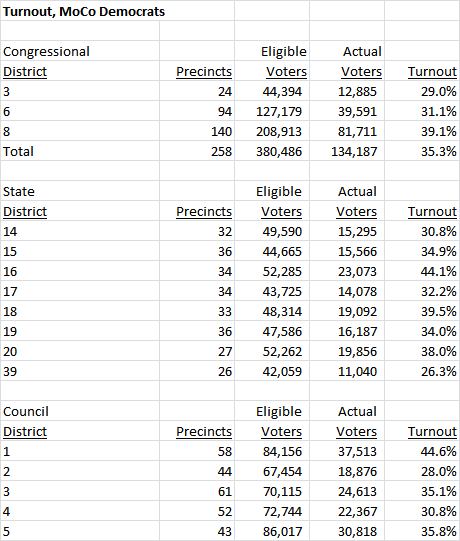
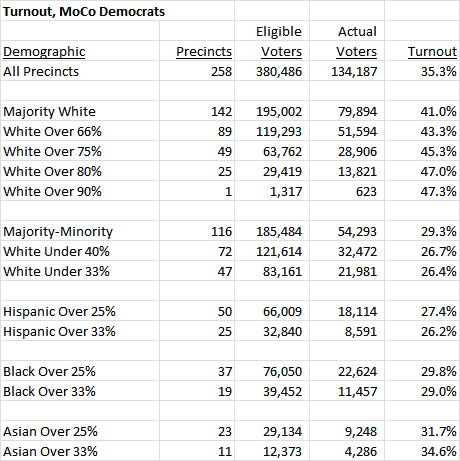
Overall, MoCo Democratic turnout was 35% in the 2018 primary, higher than the state average of 29%.  MoCo ranked second to Talbot County among the state’s 24 jurisdictions on this measure.  MoCo’s rate of 35% was higher than it was in 2010 and 2014 (26% each time) but lower than 2006 (40%) and 2002 (45%).  Still, being second in the state after being in the middle of the pack in the last two gubernatorial cycles is a good thing for MoCo.

Looking inside the county, there were vast differences in Democratic turnout between local areas.  Here are the five highest rates and the five lowest.

Highest Democratic Turnout Rates

Leisure World: 52%

Chevy Chase: 49%

Cabin John: 47%

Kensington: 45%

Takoma Park and Bethesda: 44%

Lowest Democratic Turnout Rates

Burtonsville and Damascus: 28%

Montgomery Village: 27%

Clarksburg: 27%

Germantown: 26%

Glenmont/Norbeck: 24%

These differences were reflected in state legislative and council districts.  Council District 1 led with 45% while Council District 2 was last with 28%.  State Legislative District 16 led with 44% while District 39 was last with 26%.  In the Democratic Crescent – the areas inside and near the Beltway that sent Jamie Raskin to Congress – turnout was 44%.  That compares to turnout rates of 29% in Upcounty and 34% in the rest of the county.

In precincts where support for term limits in 2016 was less than 65%, turnout was 42%.  In precincts where support for term limits was more than 80%, turnout was 31%.  This suggests confirmation of a post we wrote before the primary: Democrats who voted for term limits were less likely to vote in the primary.

Another factor that stands out is the differences among precincts based on their racial composition.  We have been matching precincts to racial data from Census tracts since the 2006 cycle.  (We have redone this numerous times since then to accommodate the 2010 Census and shifting precinct borders.)  Among majority white precincts, Democratic turnout was 41% and turnout rose as white percentage increased.  Among “majority minority” precincts, Democratic turnout was 29% and that rate fell as the white percentage declined.  Precincts that were more than 33% Latino had a combined turnout rate of 26%.

We show the full splits below.

These patterns of higher turnout in white areas, wealthy areas and the Democratic Crescent and lower turnout in Upcounty, areas with lots of people of color and lower income areas had a powerful impact on the races for Governor, County Executive and County Council At-Large.  We will begin looking at those races soon.

Share

Early Voting Turnout Heavy Among Older and African-American Voters

Yesterday, I looked at the partisanship of early voters. Today, I take a peek of the age and racial demographics of early voters based on data graciously provided by a reader.

The estimates of the racial composition of the electorate are based on estimates of the race of voters with the caveat of the potential for errors. Not everyone named Morales is Latino just as not everyone called Goldberg is Jewish. Nonetheless, the information provide a useful first cut at who is participating in early voting.

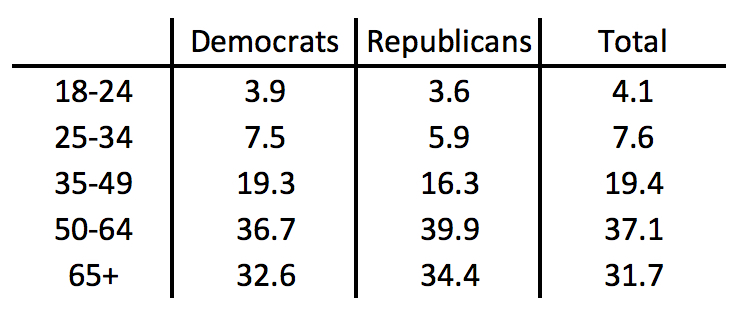
Let’s start with the percentage of the electorate in each age group broken down by party:

partybyageEarly voters skew heavily towards older voters, especially among Republicans. At 74.4%, nearly three-quarters of GOP voters are over age 50. The Democratic share older than 50 is around 5% lower at 69.3%. Among all early voters, which includes unaffiliated and third-party registrants, the share is 68.9%, slightly lower than for Democrats. The low figure reflects much less skew towards older voters among non-major party voters.

In contrast, people 35 and under make up a low share of early voters–11.7% among all voters and just 11.4% among Democrats and 9.5% among Republicans. The latter figure reflects the heavy skew away from Republicans among millennials.

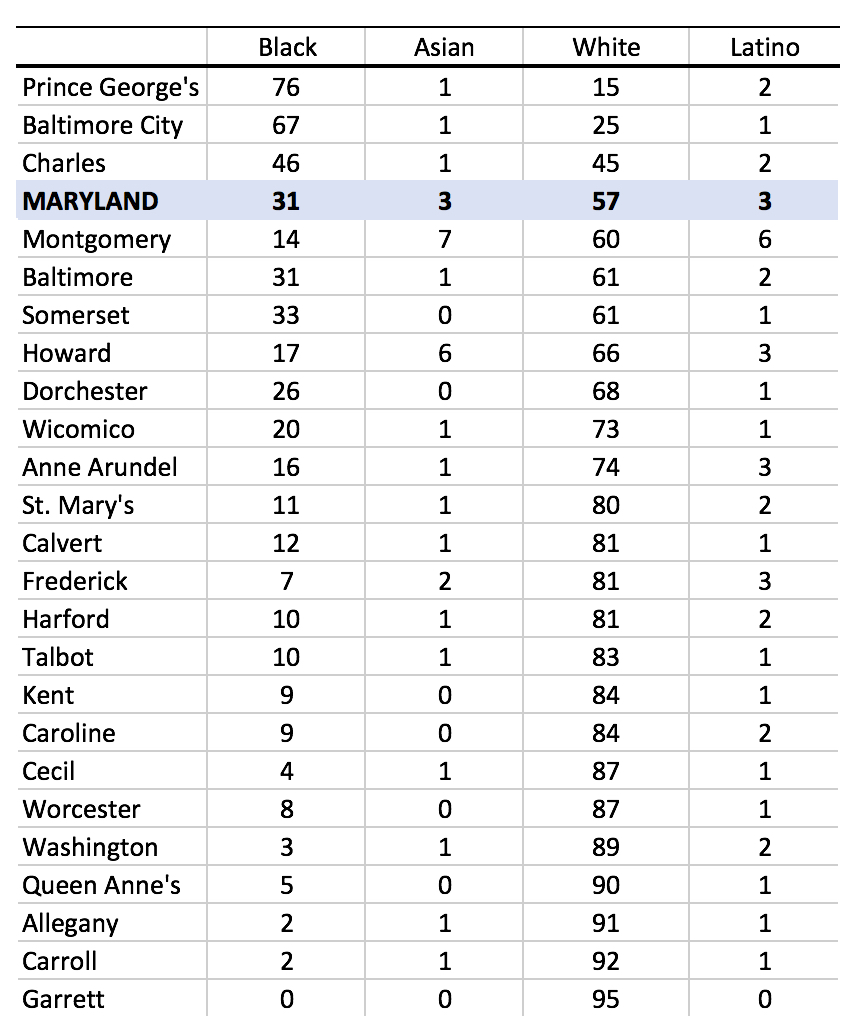
The next table shows the racial composition of each county’s electorate. Percentages add up to less than 100% because the race or ethnicity of many voters is unknown and cannot be reasonably gauged to any extent by proxies. As a result, the percentages presented here are invariably low end estimates.

countybyraceAmong early voters, African Americans are high participants (31%), exceeding their share of the voting-age population. Unsurprisingly, black participants overwhelmingly outnumber other groups in Prince George’s and Baltimore City. In Charles, African-American early voters barely edge out whites–a sign of the continuing evolution of racial demographics in that county.

The encouraging rates of black participation help explain why Democrats are consistently outperforming Republicans in early voting. Not only does Maryland have vastly more Democrats, they are voting at a higher rate than Republicans.

In contrast, Latinos (3%) and Asians (3%) appear to be casting early votes at low rates, reflecting lower rates of citizenship and turnout. Asians compose the highest share of early voters in Montgomery (7%) and Howard (6%). Latinos comprise 6% of early voters in Montgomery, and 3% in Anne Arundel, Frederick and Howard.

In Maryland as a whole, approximately 57% of early voters are white. Again, as the percentages are calculated out of total voters and many could not be placed in any category, the estimates for all racial groups are low.

Share

MoCo Dems Who Don’t Vote, Part Four

Today, I am pleased to present a guest post by Adam Pagnucco:

If Montgomery County Democrats want to substantially increase their turnout in the 2018 election, they are going to have to reach out to Democratic non-voters who are disproportionately young, Latino, African American, low income and who live far from the party’s traditional Downcounty strongholds.

How can that be done?

First, this is not a job that can be entrusted to candidates alone.  Candidates are in the business of winning elections, and for them, that means targeting regular voters.  That’s perfectly understandable.  Asking candidates to do things that don’t maximize their chances to win is a non-starter.  So this is a job for the party.

Montgomery County’s Democratic Party is in some ways the envy of the rest of the state.  It is large and well-financed.  It can draw on lots of volunteers and activists, many of whom have substantial campaign experience.  It has a system of precinct officials that most county parties don’t have.  But in recent years, it has presided over declining turnout.  Like any organization, even successful ones, the party can improve.  Here’s how.

1. Buy an email list and use it.

At the moment, the party does not have an extensive email list.  It needs one – badly.  The party should purchase an email list of regular voters – including unaffiliated ones – and start pumping out regular blasts.  The state party does this and the county party should start doing it too.  But in addition to the frequent attacks on the GOP that appear in state party emails, the county party can also celebrate the successes of local government.  The Montgomery County Council regularly passes progressive legislation, often on unanimous votes, and the County Executive leads a progressive administration.  The declining local media misses out on a lot of these things, so the party should step in and spread the word.

2. Get stronger on social media.

The county party’s Facebook page needs to be bolder and more topical.  It should be aggressive about going after the GOP and it should also trumpet Democratic successes.  Ads should be used to spread particularly good posts and to build the like count.

3. Contact non-voters and new voters directly.

Years ago, before the spread of e-recruitment, the party had a system for welcoming new voters.  That system should be reinstated and updated.  The party can use its precinct officials to reach out to non-voters and new voters on the ground.  One way would be to send precinct officials lists of all of these voters and have them circulate an online survey through flyers in their neighborhoods.  Do they vote?  If not, why?  Is it lack of information?  Are there important issues they want addressed?  Ask them to sign up for the email list and Facebook page to stay in touch with the party.

4. Spotlight new Democrats.

Non-voters and new voters don’t look like Mike Miller or Mike Busch.  They look like many young, new Democratic state legislators like Senator Craig Zucker and Delegates Eric Luedtke, David Fraser-Hidalgo, Ariana Kelly, Marc Korman, Marice Morales, David Moon, Will Smith, Pam Queen and Shane Robinson.  (And those are just the ones who first took office in 2010 or later.)  Let new Democrats like these do guest communications in the blast emails and also on a county party blog.  Then spread them through Facebook and Twitter.

5. Get rid of the sample ballot.

The above items will cost money, and a good place to get it is by getting rid of the sample ballot.  This drab, antiquated pamphlet mailed to all Democrats before the general election looks worse than a typical coupon book and is probably discarded promptly by most recipients.  The party spends tens of thousands on printing and mailing it every cycle.  Besides causing headaches for no good reason, the sample ballot distracts from the party’s central duties because it is the vehicle for communicating party positions on ballot questions, and that can cause problems.

One example was the party’s decision to go against labor on the police effects bargaining ballot question in 2012.  Regardless of who was right or wrong, the decision caused labor to picket the party’s spring fundraiser and resulted in wholesale turnover on the party’s central committee.  The party’s primary duty is to market its candidates and their successes.  It should not concentrate on making policy decisions outside of its stated platform; those should be left to elected officials.

The sample ballot has been around for a long time and it has its defenders, but party strategists need to ask themselves the following question.  How many email addresses, Facebook ads, staff hours and other voter touches can be purchased by freeing up money from the sample ballot?  And what mix of all of these factors generates the greatest cost effectiveness for outreach?

If all of these things are done, will that guarantee higher turnout among MoCo Dems who currently don’t vote in 2018?  Well, there are few guarantees in politics, folks.  But I will guarantee this: if none of these things are done, turnout will not improve and Governor Larry Hogan will get a second term.
Share